In twenty years of software development, I did not have the privilege of being on call, of tending to my software in production. I’ve never understood what “APM” means. Anybody can tell me what it stands for—Application Performance Monitoring (or sometimes, the M means Management)—but what does it mean? What do people use APM for?
Now, I work at an observability company—and still, no one can give me a satisfying definition of “APM.” So I did some research, and now the use of APM makes sense from a few angles.
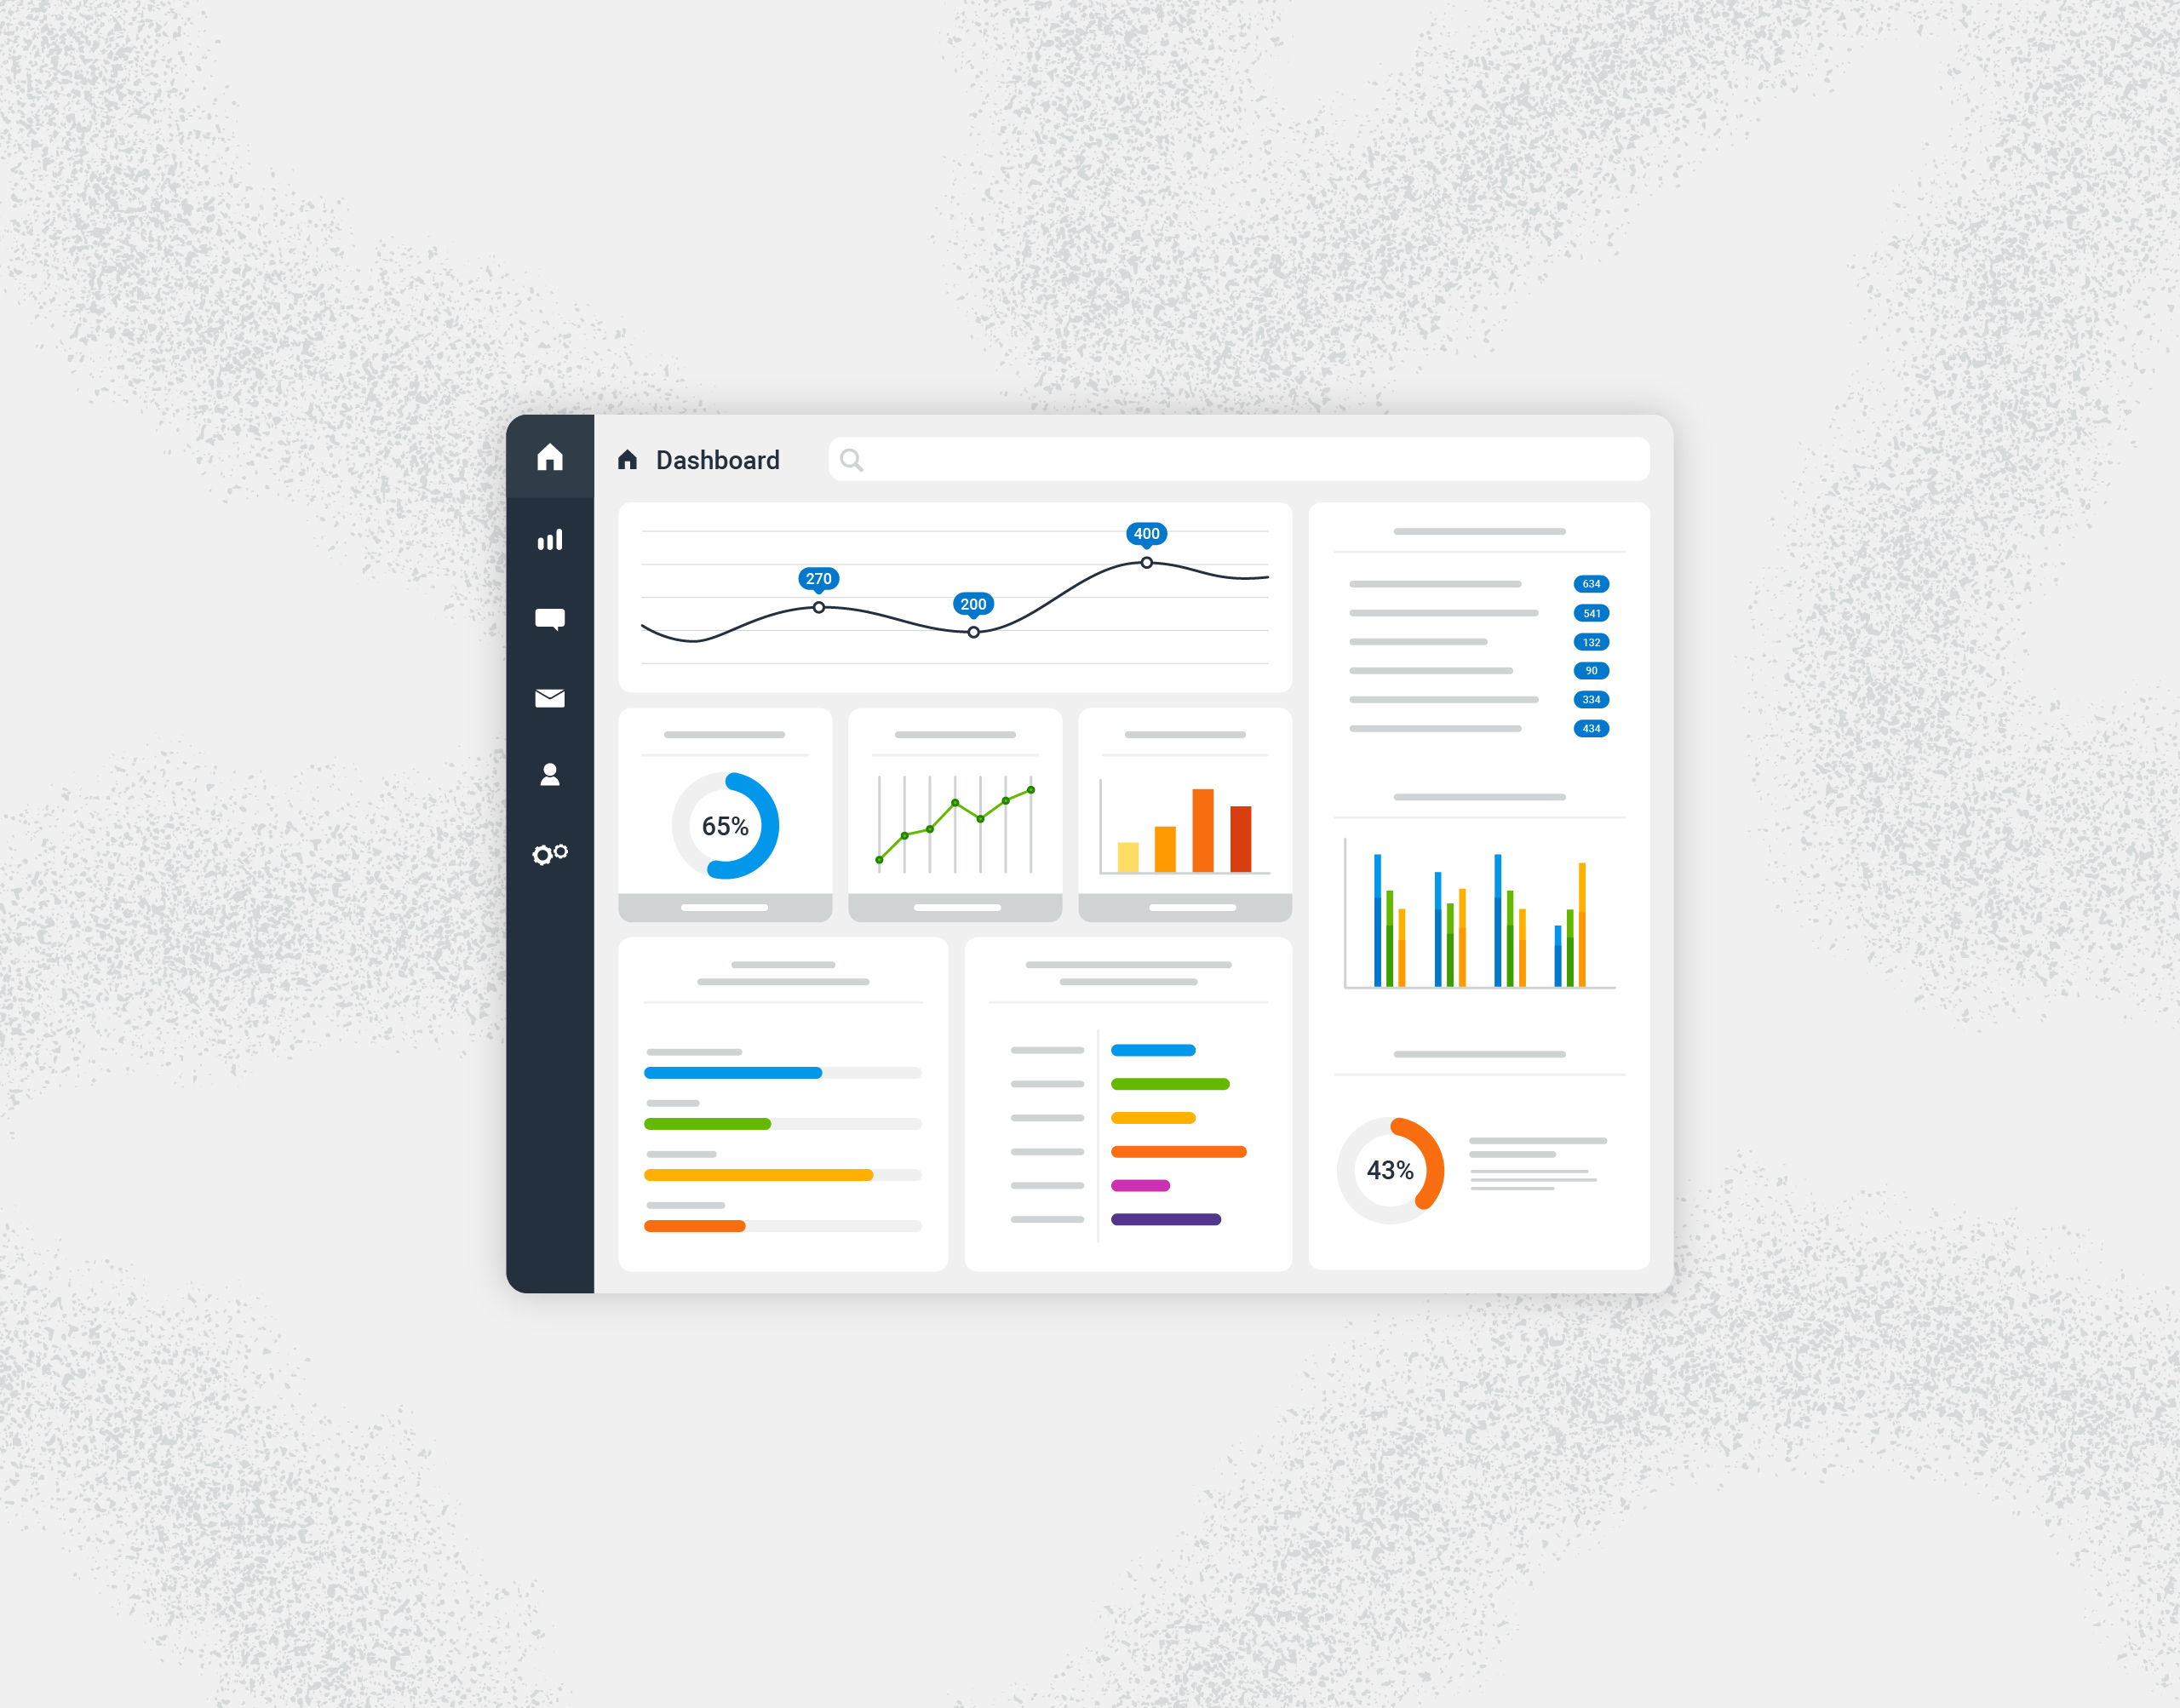
“APM is having all your dashboards for a specific application. You can see usage, databases… not just infrastructure.”
Paul Balogh
M when it means Monitoring
Monitoring starts at the infrastructure layer. Is the network switch working or not? Metrics were invented to check current conditions against known measurements of working or not working.
Before cloud and autoscaling, humans had to intervene when their servers had problems. So metrics and monitoring got extended to servers. Is the server up? Does it have enough disk space? Is it CPU-bound, or out of memory? To get people’s attention, folks used tools like Nagios for alerting back in the 2000s. Nagios checks servers for problems and sends a notification when it sees one.
But Nagios didn’t tell us anything about servers when they were working, and it didn’t give us history about what happened just before the server went down.
So then, tools like statsd started checking state every few seconds and reporting that to something like Graphite, which stored that time-series data and graphed it.
As the number of servers we tracked increased, tools improved. Infrastructure monitoring remains useful. Now that Kubernetes can handle restarts and scaling, data about successful operations is especially important. That data can help us understand and control costs, and notice when infrastructure is affecting application performance.
We care about that because infrastructure exists to run applications! Applications impact our customers.
A is for Application
As a developer, I write code. But code itself doesn’t provide any value. Software must run in production to provide value to customers (internal or external).
APM extends monitoring to applications. To monitor applications, we measure each running service. We take measurements, like is it up? Is it responding? How many responses did it make? How many errors did it have? How long do those responses take?
Applications can impact both their underlying server infrastructure and other applications. This causality became extra relevant back in the 2000s when we started putting multiple apps into a single process (I remember WebSphere). Nowadays, Kubernetes packs many isolated applications running inside containers onto each server. So we also need to know, how much memory is this process using? How much CPU?
All of those application-related metrics compose dashboards, and that looks like APM.
But is that enough? Infrastructure metrics should be standard. We want every server to behave like every other server. But with applications, every piece of software does something unique. Hmm.
P is for Performance
Having code that works is not enough. Code that runs very slow can be worse than code that’s all together down. We want code that performs well: errors are rare, responses are fast, and memory usage is reasonable.
APM measures some of these “non-functional requirements.” In the 2010s, distributed tracing emerged as part of APM. Traces display overall latency and the time taken by each component, plus where errors happen and everything that passes them along. Now we have hope of fixing errors and reducing latency.
To improve performance, the same people who can change the code need access to those measurements, and the details of distributed tracing. In my past development work, I never had that. APM tools were priced per seat, so only operations had access.
M when it means Management
In the end, the answers to questions like, “how fast is fast enough?” and “how reliable is good enough?” are business decisions. The answers are about meeting customer expectations or contractual SLAs. Data from APM gives decision makers a representative view into what the software is doing and how people use it.
Back in the day, companies spent millions on bespoke APM because they had particular business questions to answer about software usage and performance. Users specified what they needed to know about every transaction moving through the system. That information was priceless to them, and bespoke APM was just as pricey.
Few could afford it, but everyone needed it. And a lot of those questions weren’t specific to one business. Back when most companies started as a Rails app, the original New Relic provided a good window into what was going on. Dynatrace agents had super clever ways of extracting information without asking people for code modifications. That meant people making decisions for the business could do so without asking developers to do anything.
That dynamic helped APM go from expensive custom implementations that filled specific business needs to needing zero code changes to provide relatively predictable pricing for generic measurements. APM then became a standard line item in the budget for most operations teams.
Adding APM as a bolt-on standardized tool brought it into mainstream use. That shift was forward motion for the software industry! It got us to our standard of always-up websites—and that reliability helped proliferate software as a service.
But I think we lost a few things along the way, and the next standard for application performance management gets those back.
Where we go from here
Every piece of software does something unique. There are business questions more specific than “is it up?” and “is it fast?”
With modern infrastructure, autoscaling and healing can fix ‘fully down’ or ‘always slow.’ However, they can’t help with a new error or degradation that leaves most responses OK but destroys the experience for an important few.
Each multi-tenant SaaS provider needs to know how their services perform differently per customer. A payment provider needs to measure activity level for each account, because something way above normal is a flag for fraud. These are details that basic APM doesn’t cover.
As a developer, I want to see the usage and input variation for the feature I added this week. I want to look at that as it goes to production. This way I know it’s working the way I expected, and I learn how people use it in real life. For this, I need access to production, and I need to add custom fields on a regular basis, without worrying that they’ll blow up another department’s monitoring bill.
When we moved to bolt-on solutions, customization became difficult and expensive, and developers had to ask permission from operations to learn more about their code in production.
Can we get the optimal business metrics, the development feedback loop, and more detailed operational data without reimplementing any of the standard parts that everybody needs?
Observability 2.0 enters the chat
This is where APM is going: just enough customization to get what our business and developers need while keeping the work to a minimum, and letting operations standardize on common tools. At Honeycomb, we call it observability 2.0. Custom metrics or fields shouldn’t cost extra, because every log and trace field is a subject for analysis and graphing. Product, sales, support, and developers access this application performance data, each asking their own questions.
Classic APM is an important step toward observability. Now, top-of-the-line observability provides comprehensive software performance analysis to support business understanding, decision making, and active development. Dashboards for each application is only a beginning.
I won’t develop software without this access again.
Acknowledgements: Patrick Hubbard, Andy Hawkins, Paul Balogh, George Miranda.


