Ask Miss O11y: Making Sense of OpenTelemetry—Tracer and TracerProvider
“There’s a lot to understand in OpenTelemetry; for instance, what is the difference between a Tracer and a TracerProvider? How should I use them?” OpenTelemetry is a strong standard for instrumentation because it is…

“There’s a lot to understand in OpenTelemetry; for instance, what is the difference between a Tracer and a TracerProvider? How should I use them?”
OpenTelemetry is a strong standard for instrumentation because it is built of careful, well-thought-out abstractions created by experts in the space.
OpenTelemetry feels painful to start using because it’s full of abstractions that make sense to experts in the space. For a developer who wants to think about their own software and not spend a month becoming an expert in telemetry, this is hard.
For high-level conceptual description, there’s the OpenTelemetry specification. For basic what-to-type, there’s the getting-started guides for various languages (Go, JavaScript, and more).
For the in-between of “How does this all connect?” and “What does it mean?” Miss O11y is here for you!
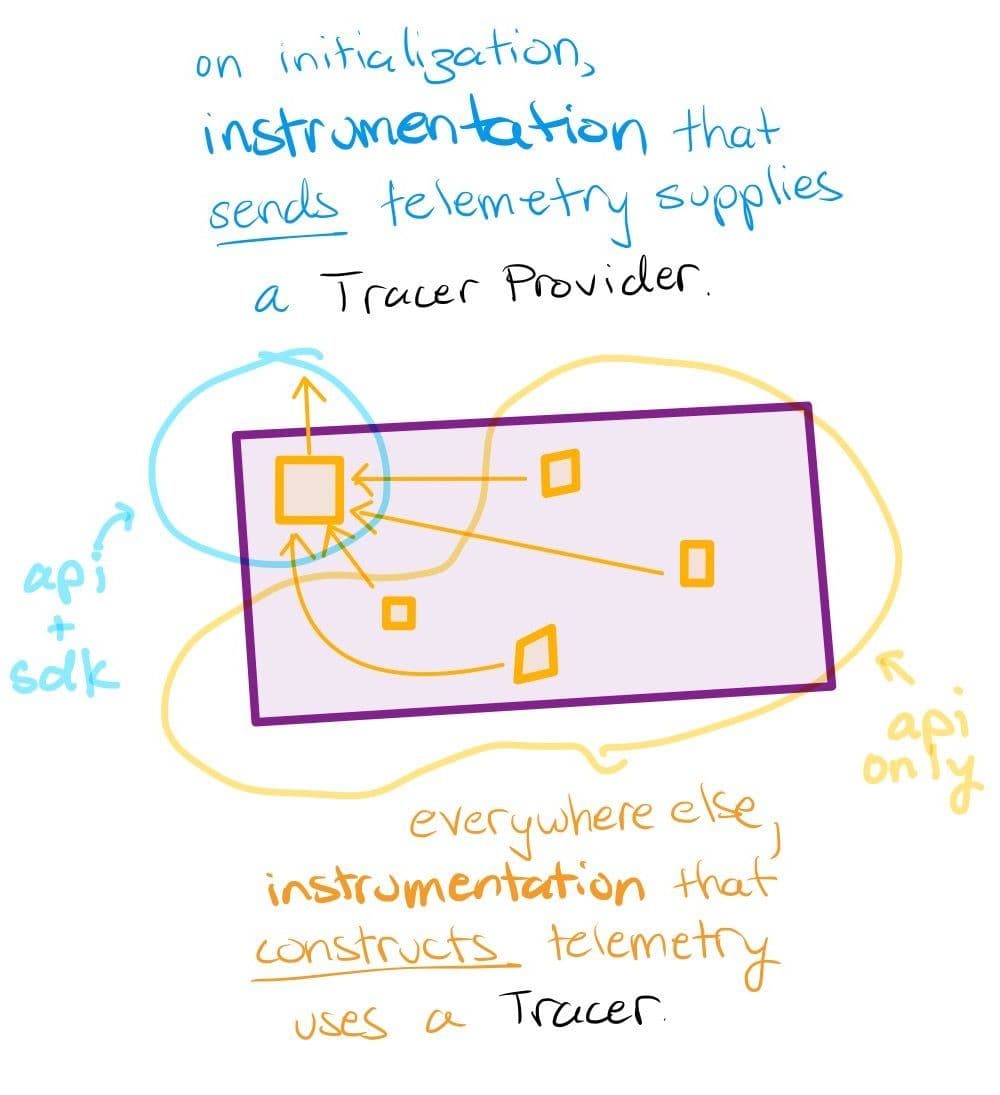
TL;DR: a TracerProvider (usually there’s exactly one) knows how to send telemetry out. It can give you a Tracer, which lets you construct spans.
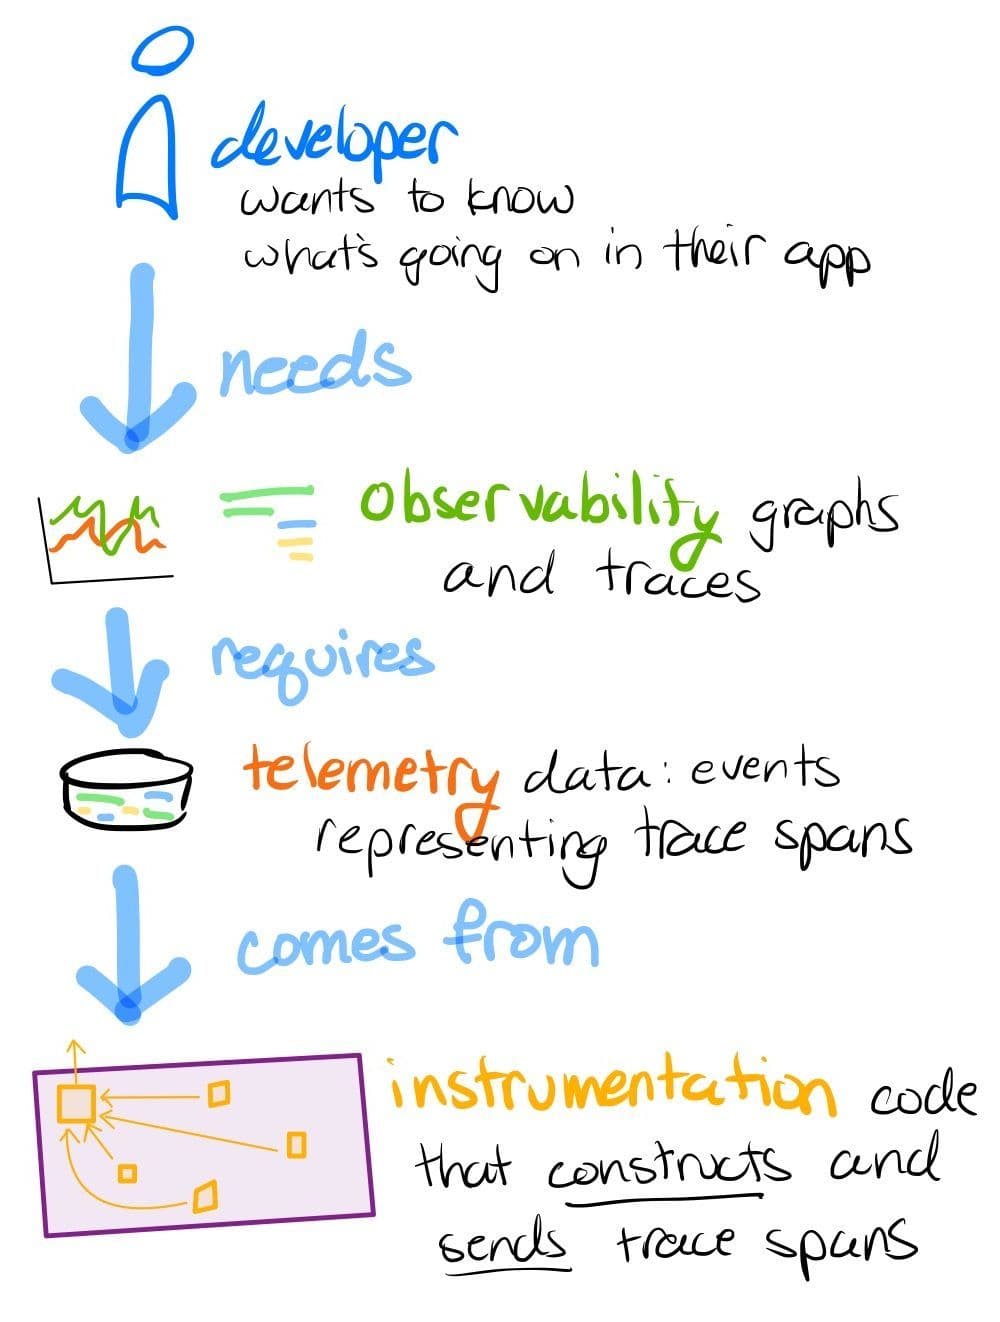
In our quest to understand what’s going on in our applications, we want observability, which requires our app to send telemetry data, which happens in instrumentation code.

Construct traces
We construct spans with a Tracer. The spec doesn’t say exactly how because each language uses idiomatic method names.
In JavaScript, you might call `tracer.startSpan(“span name”)` or `tracer.startActiveSpan(“span name”, cb)`. Which you choose affects the way spans get connected.
In Go, you use `tracer.startSpan(ctx, “span name”)`. Which context `ctx` you pass determines how spans get connected.
Where does that Tracer come from?
From the air! The air inside the OpenTelemetry API, that is.
The syntax is different in every language, but the steps are usually: import the OpenTelemetry API and ask it for a Tracer.
In JavaScript:
```

const opentelemetry = require(“@opentelemetry/api”);

const tracer  = opentelemetry.trace.getTracer(“my package name”);

```In Go:
```

import (

"go.opentelemetry.io/otel"

"go.opentelemetry.io/otel/attribute"

"go.opentelemetry.io/otel/trace"

)

…

tracer := otel.Tracer(“my package name”)

```The name that you pass in becomes the `library.name` field in all spans created by the Tracer. The meaning of this field is: Whose instrumentation created the span? So use the name of your application or of the current package. If you’re writing a library, definitely use that name.
How many Tracers should you have? Any number. Ask for one in every file, or every function, or every time you want to create a span. This is fine.
No really, where does that Tracer come from?
If the only OpenTelemetry packages you bring in are from the API, then you get a default. It’s a no-op Tracer—when you create a span, it does nothing.
That way, if you publish a library with its own instrumentation (for instance: Apollo GraphQL), and people use it in applications that don’t set up OpenTelemetry, nothing breaks. The OpenTelemetry API packages contain only no-op versions of the abstractions it exposes. You can write code against them, but it won’t do anything until someone includes code to send the telemetry.
Send traces
To activate all that telemetry-construction code, bring in more than the OpenTelemetry API. Bring in an implementation, usually in the form of the OpenTelemetry SDK for that language.
Then configure a TracerProvider that knows how to send telemetry out.
See, when your span-constructing instrumentation asks for a Tracer, the API is getting one from the global TracerProvider. (You knew it! You could guess it from the name!)
To construct real spans and transmit them to your observability platform, configure a real TracerProvider in initialization of your application.
This usually means creating at least an Exporter, a SpanProcessor, a Resource. Those are out of scope for this post. The syntax is different in each language. The (many) packages you need are different in each language. The examples in the documentation are a starting point. Then the OpenTelemetry registry can help you find instrumentation libraries helpful to your specific app.
Your goal is to configure a TracerProvider and then install it as the global one. You get one TracerProvider for the whole application. It may be possible to have more, but it would be strange.
For instance, in Node.js, you can instantiate a `NodeTracerProvider`, configure its exporters, and then call `provider.register()` to install it globally. (In Node, you can instead initialize the SDK with `new SDK(…)` which does this internally.) My favorite example for this, which we keep up to date, is here.
In Go, you’ll create a TracerProvider and then call `otel.SetTracerProvider(tp)`. An example for connecting to Honeycomb is here.

That’s two of the OpenTelemetry abstractions. Want to hear about others? Send us a question!
Got telemetry, want to see it clearly? Sign up for a free Honeycomb account!
Want to know more?
Talk to our team to arrange a custom demo or for help finding the right plan.
