Destroy on Friday: The Big Day 🧨 A Chaos Engineering Experiment – Part 2
In my last blog post, I explained why we decided to destroy one third of our infrastructure in production just to see what would happen. This is part two, where I go over the big day. How did our chaos engineering experiment go? Find out below!

By: Lex Neva

In my last blog post, I explained why we decided to destroy one third of our infrastructure in production just to see what would happen. This is part two, where I go over the big day. How did our chaos engineering experiment go? Find out below!
Excitement, but also low-key stress
For our big test in production, we would use AWS’s Fault Injection Service (FIS) to simulate the failure, just as we had done in Dogfood and Kibble. FIS is an Amazon service that helps us simulate cloud failures by performing a series of actions in a predefined sequence. Our FIS template performs the following actions simultaneously:
- Abruptly terminate all EC2 instances in the AZ (aws:ec2:terminate-instances)
- Drop all network communication into and out of the affected AZ (aws:network:disrupt-connectivity)
- Prevent new EC2 instances from being created in the affected AZ (aws:ec2:asg-insufficient-instance-capacity-error)
In Part 1, I mentioned that we ran into a little bit of trouble related to PrivateLink. When we ran an FIS experiment like this, we saw that some requests to api.honeycomb.io experienced HTTP 504 errors for an extended period of time. Here’s a bit more on what went wrong and what we did to prevent this from affecting real customers.
By using PrivateLink, our customers can save money when they send us their telemetry data if they run in AWS like we do. Instead of sending their telemetry out onto the internet to reach api.honeycomb.io, PrivateLink gives them a magic tunnel straight through the AWS network to reach us without their network packets ever traversing the Internet. It looks like this simplified diagram:
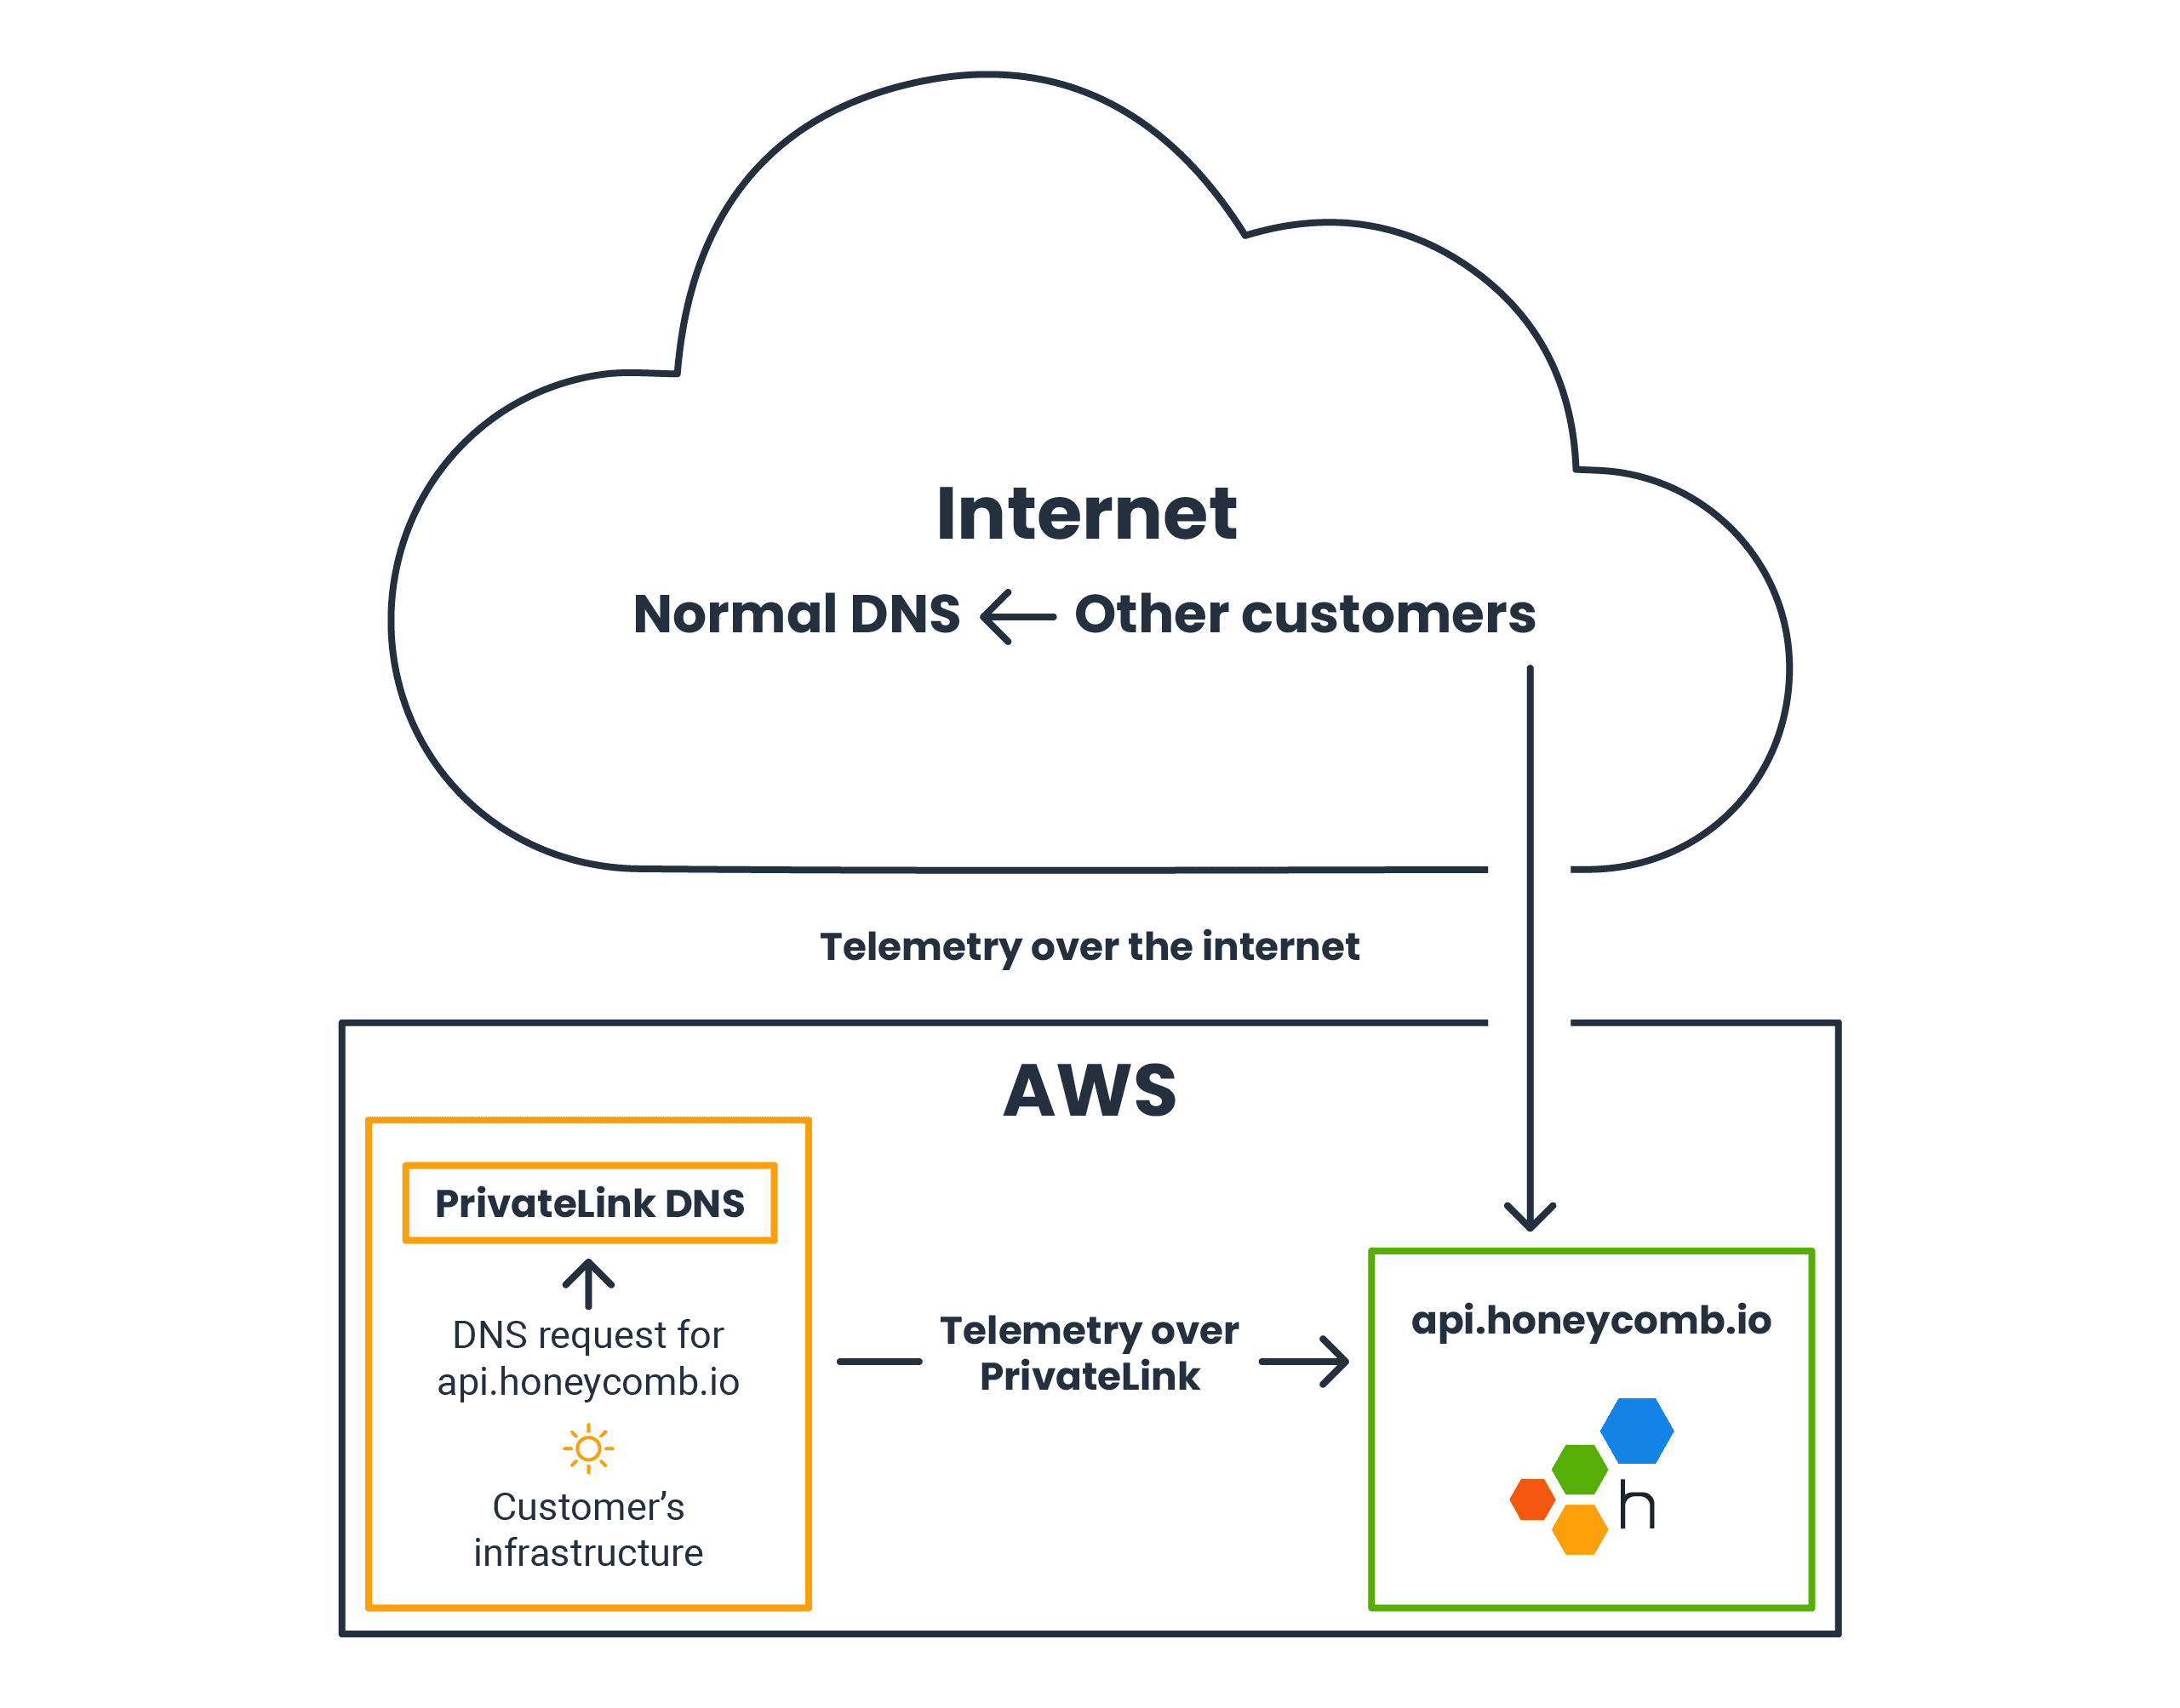
In the internet section resides another customer. That customer’s DNS request goes to the public DNS service, and their telemetry goes over the internet to Honeycomb.
We expose a Network Load Balancer (NLB) to customers through PrivateLink that routes their traffic to our main Application Load Balancer for api.honeycomb.io. When the customer’s application does a DNS lookup for api.honeycomb.io, instead of receiving normal internet-facing IP addresses, PrivateLink steps in and returns a special local address that points to the NLB. Traffic over this NLB is transparently routed from the customer’s VPC to ours without ever leaving AWS—and without being charged for network egress.
Normally, this works really well! However, in the very specific scenario created by our FIS experiment, there’s a problem, as shown in this diagram:
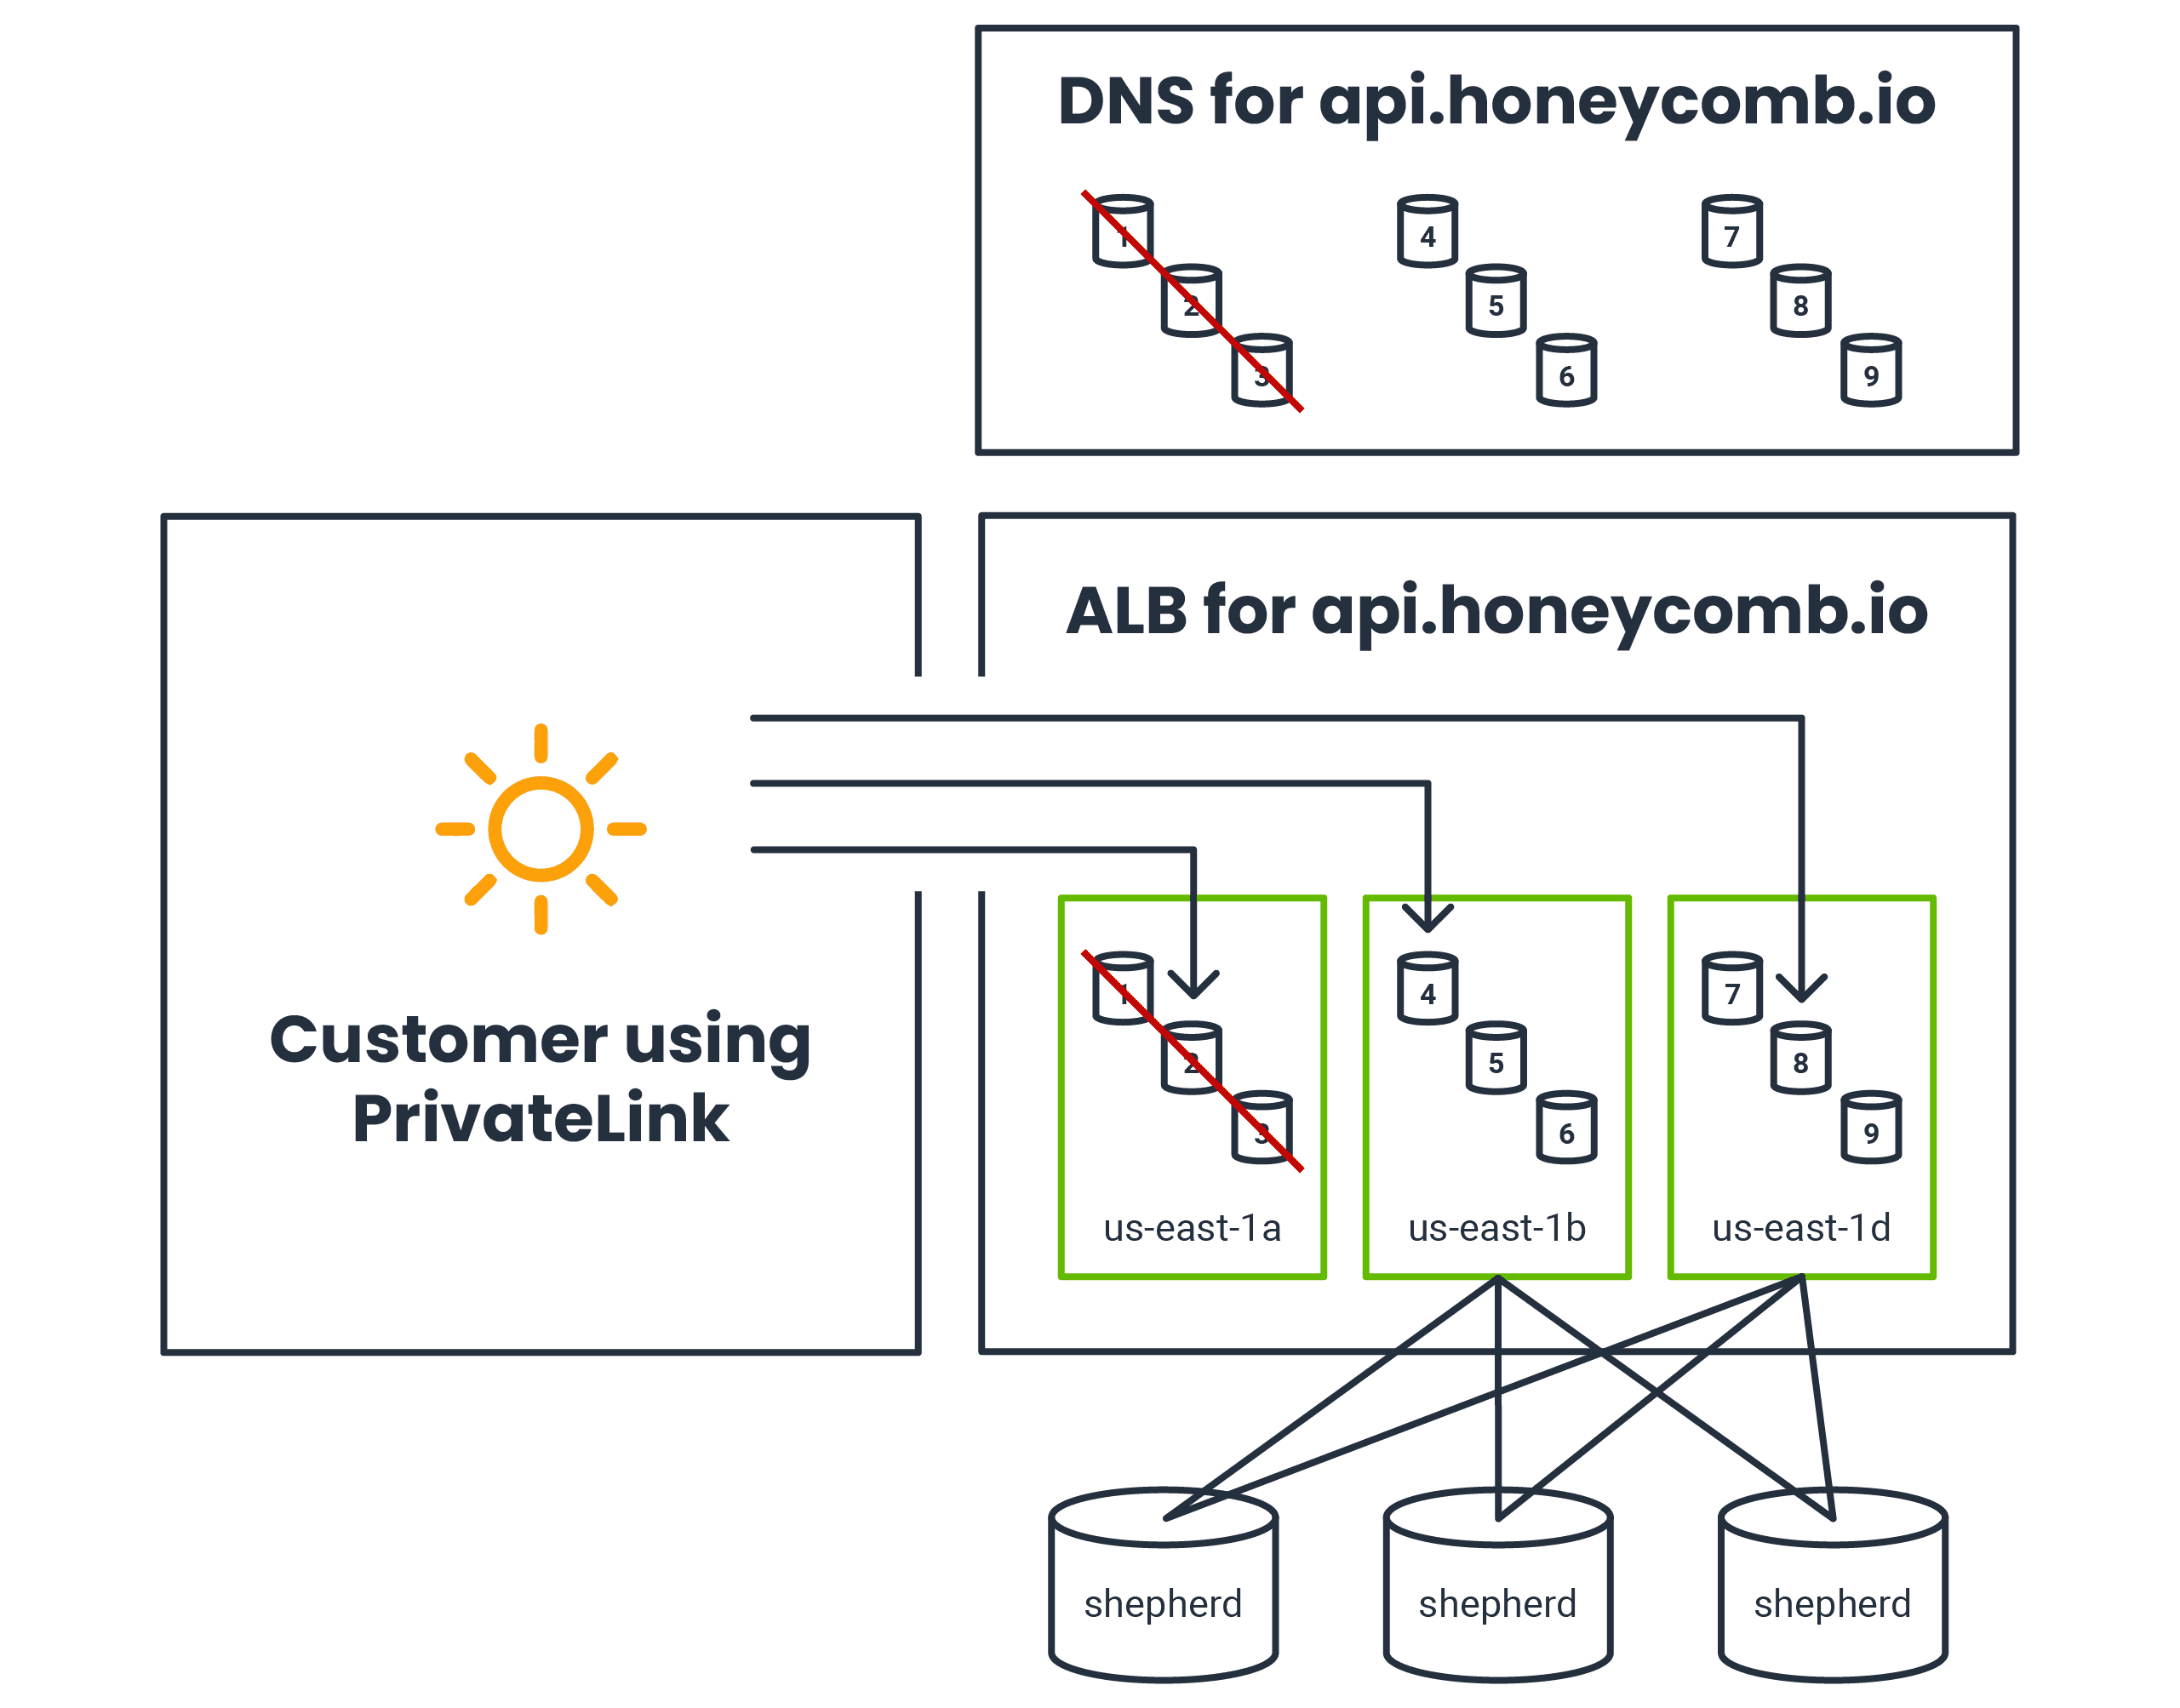
The public DNS is depicted, with only the ALB nodes in us-east-1b and us-east-1d in the DNS for api.honeycomb.io. The customer using PrivateLink sends traffic to ALB nodes in all three AZs, including the unhealthy ones in us-east-1a, bypassing the public DNS.
The FIS test terminates Shepherd backends in us-east-1a and cuts the entire AZ off from the network. The ALB has its own internal nodes that are invisible to us—you can see evidence of them in the ALB-managed DNS for api.honeycomb.io. The ALB nodes in us-east-1a aren’t terminated, but they’re unable to forward requests even to the Shepherd backends in the other two AZs. The ALB quickly detects that these ALB nodes aren’t functioning properly and removes them from the internet-facing DNS.
However, PrivateLink circumvents the DNS. From what we can tell, the NLB can still forward some requests to the ALB nodes in us-east-1a (nodes 1-3 in the diagram). These ALB nodes are completely cut off and have no choice but to return 504 for all requests, indicating that all backends are unhealthy. This means that the portion of customer application hosts that currently have a long-lived GRPC connection open to nodes in us-east-1a start receiving 504 errors.
Worse yet, these are valid HTTP responses, so the customer application may keep this connection open indefinitely and continue trying to send telemetry that the ALB node can’t forward on. We’ve seen this continue on for over ten minutes!
Fortunately, we found a workaround. Right before we started the FIS experiment, we preemptively told the ALB to stop using us-east-1a. This caused the ALB nodes in us-east-1a to be terminated, sidestepping the issue altogether.
In a true AZ failure, the ALB nodes in the affected AZ would presumably be knocked offline just as the rest of the infrastructure, and this wouldn’t be an issue. We hope that one day, FIS might be able to terminate the internal ALB nodes in an AZ for us—or at least simulate their failure more completely. We had a chat with our friends at AWS to provide this feedback, and they were very receptive.
With that last detail handled, we were ready for the big day! We preemptively launched an internal incident to improve coordination and to ensure that we were ready for anything unexpected. We monitored our systems closely, and we hit the big red button.
Screams internally
At first, things looked unexpectedly rough! Here’s what our telemetry from Shepherd looked like:
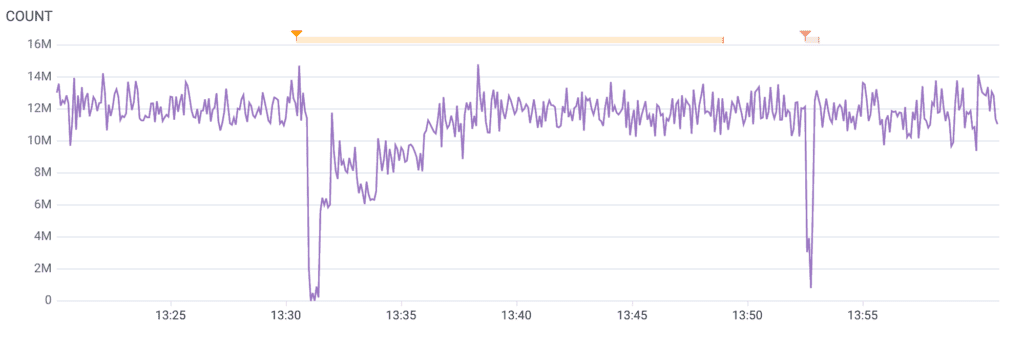
This graph appears to show a significant decrease in traffic to Shepherd, possibly including a near-total ingestion outage. Things were improving, but this was still far more impact than we had hoped for.
…actually wait, it’s fine!
Thankfully, this was just a drop in the metrics about Shepherd, not in actual requests served. Metrics from our AWS Application Load Balancer (ALB) showed that traffic continued nearly uninterrupted:
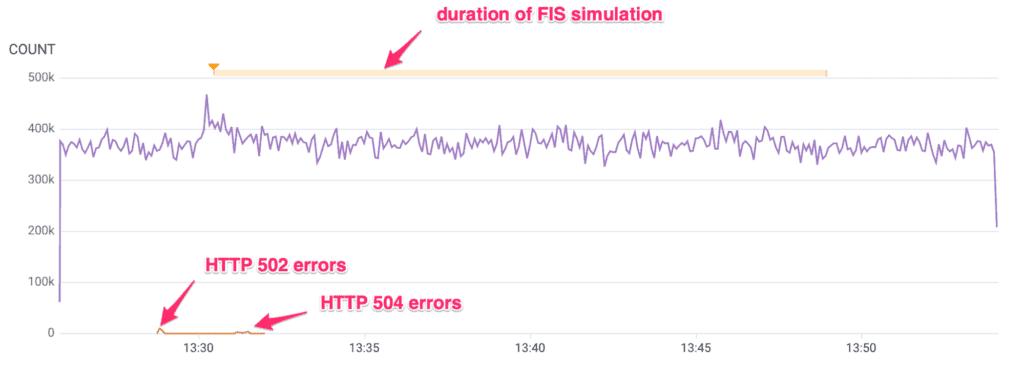
We saw a small number of HTTP 500 errors in two distinct bursts. The first batch of errors were HTTP 502s and coincided with the PrivateLink workaround. It should be noted that this minor impact is an artifact of our workaround and would not be expected in a true AZ failure.
The second batch of errors were HTTP 504s. We theorize that this was when customer traffic reached the internal portion of the ALB that was in the AZ we had cordoned off from the network, and the requests could not be satisfied. Clients would have retried and reached the two AZs that were still up. If we’re right, this would also be an artifact of our simulation method and not something that would happen in a real AZ failure.
Combined, both kinds of HTTP 500 errors occurred for about 31 seconds, affecting about one percent of requests. Such a short and low impact matched our non-production tests and was well within our error budget.
But why did our Shepherd graph try to give us a heart attack? Our telemetry from Production runs through Refinery, our smart sampling proxy, on its way to Dogfood. One third of Refinery’s infrastructure had been terminated just as with everything else in production. This meant that all the data that was being processed on those Refineries was lost. Since Refinery caches information while it’s processing it, it took a while to refill its caches and for the other Refineries in the network to notice that the configuration had changed.
Other than the few HTTP 500 errors, customers’ HTTP requests were handled successfully, even as we abruptly shut down a third of our entire infrastructure. As we saw in our early tests, some customers saw brief delays in their Honeycomb queries. Other customers saw queries fail, and resubmitting the queries would have succeeded a short time later. This was a novel failure mode that we did not see in our earlier tests, validating our belief that the only way to truly understand how Production behaves is to test in production. Work is already well underway to fix this behavior, and the impact made only a very small dent in our SLO, again well under our error budget.
Success!
After about 15 minutes, it was clear to us that our system was stable and could continue operating indefinitely with just two AZs. This Honeycomb query shows how Shepherd fared:
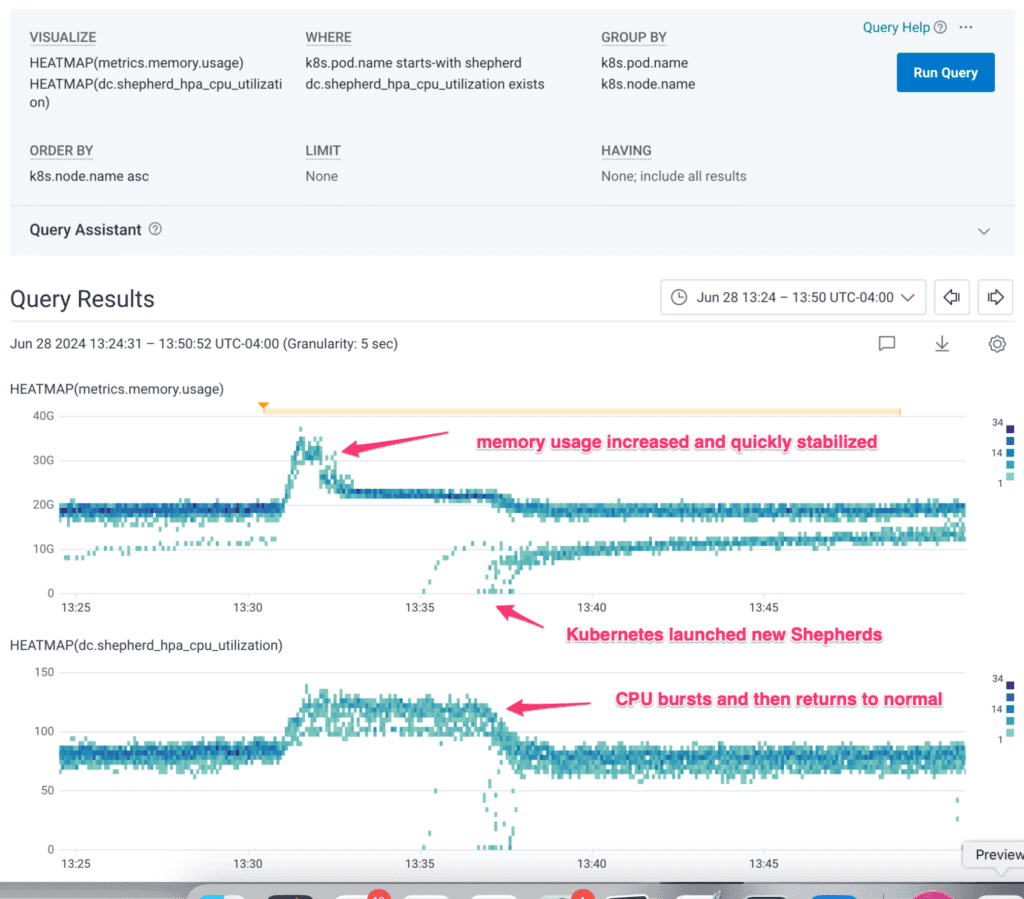
The remaining Shepherds handled the excess load, and Kubernetes quickly launched new Shepherds to replace the ones lost in the simulated AZ failure.
Seeing this, we were ready to end the test. We halted the FIS simulation and reversed the PrivateLink mitigation, allowing our system to recover. Kubernetes quickly began rebalancing various services back to three AZs:
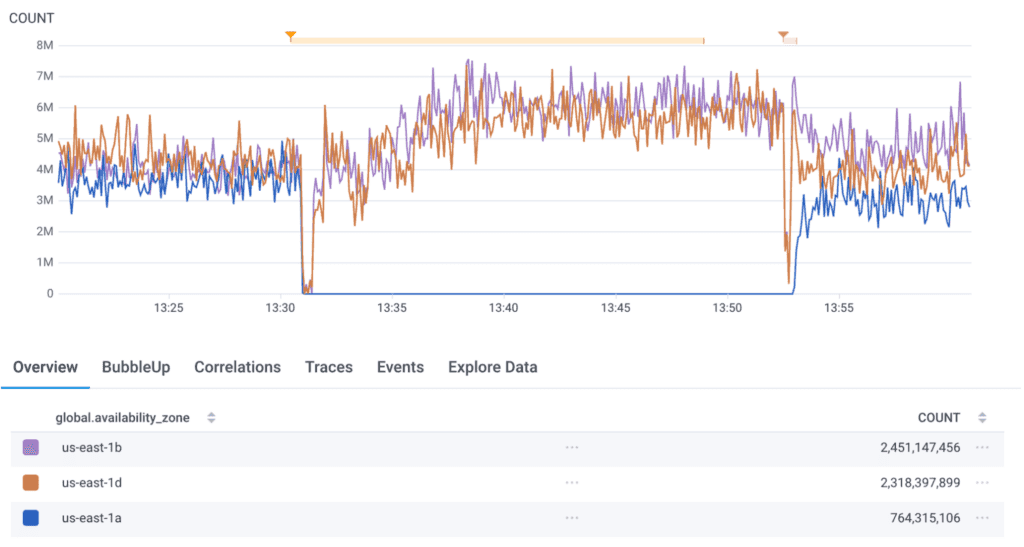
This graph is the same as that earlier Shepherd graph, but grouped by availability zone. There’s another sudden dip at the end that once again corresponds to Refinery stress relief as Kubernetes began killing Refinery pods and relocating them to us-east-1a. Our other services recovered similarly, and within an hour or two, our infrastructure was back to normal. We even got this cool graph showing 80 of our Retriever partitions rebuilding redundancy:
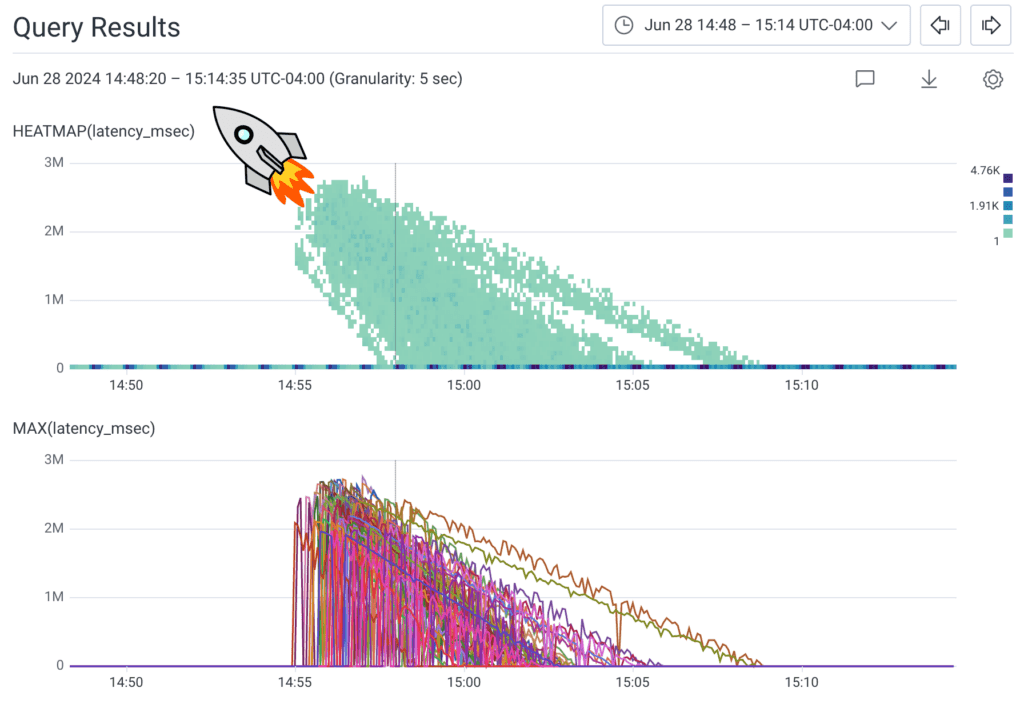
Make your own cool rocket graphs. Get Honeycomb today.
This graph shows the latency of the Retrievers that were launched after the AZ failure test. Each Retriever starts off behind by around an hour, then quickly catches up as it reads the backlog of data from Kafka.
Kafka took a total of 11 hours to reach full redundancy, rebuilding three brokers while also serving all of our usual traffic. We’re pretty happy with this, since it usually takes six hours to rebuild after the failure of just one Kafka broker. We test Kafka’s rebuilding capability regularly by terminating one broker every week.
Here’s what it looked like when Kafka rebuilt three brokers:
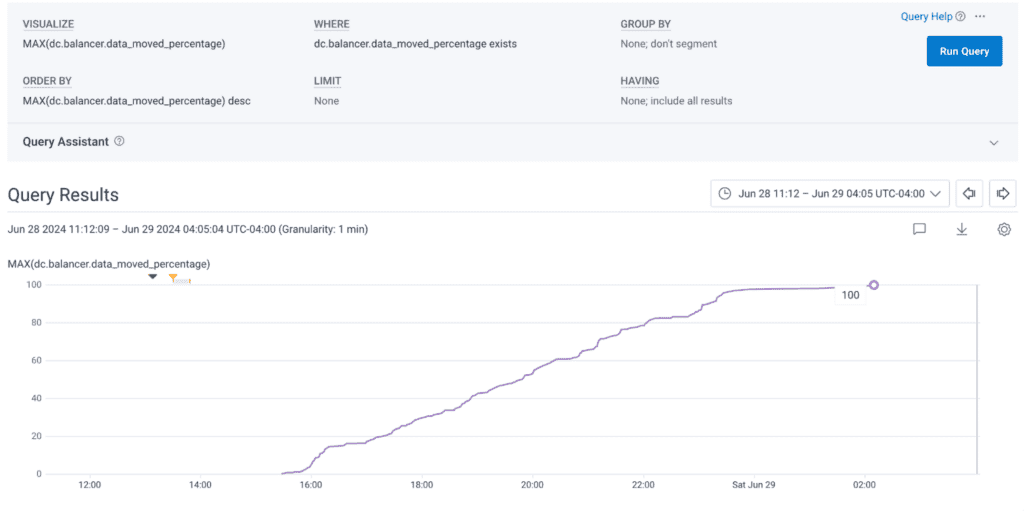
We can see that within just eight hours, 97% of the rebuild was complete, with the final 3% finishing up at the 11-hour mark.
Further work
Our chaos experiment had only very minimal impact and no abnormal burn on our SLOs. In exchange, we learned valuable lessons about our infrastructure, uncovered and fixed bugs, and validated our confidence in the reliability of our system. We’re excited by these results, and we plan to perform similar experiments regularly (with pre-production tests first!) in order to continually validate the ability of our service to withstand this kind of major AWS failure.
Are you planning to run your own chaos experiments? We’d love to hear about it! Join us in our Pollinators Slack to keep the experiments going.
Want to know more?
Talk to our team to arrange a custom demo or for help finding the right plan.