How to Get Infinite Custom Metrics For Free
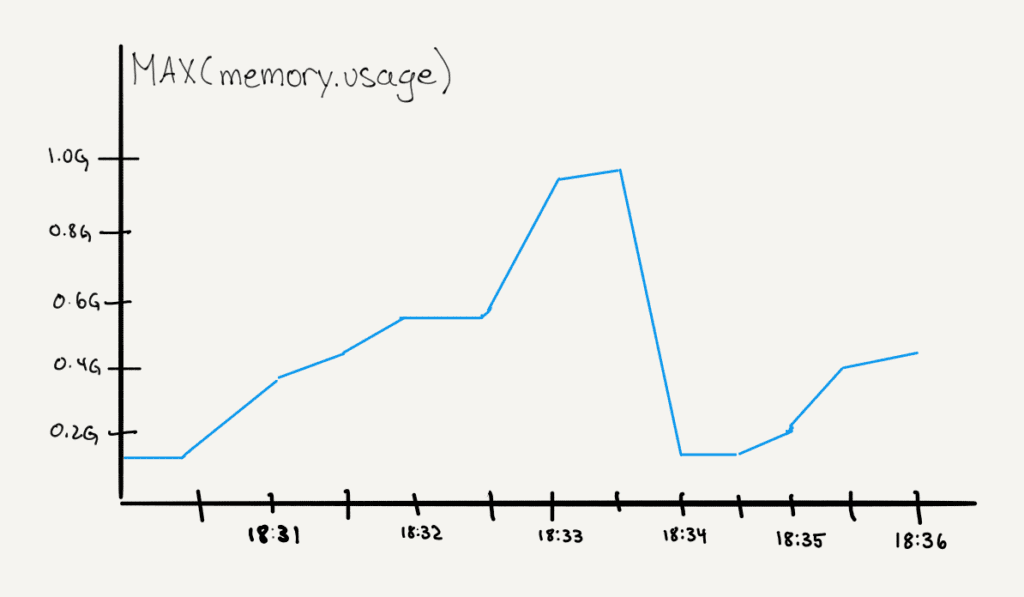
Oh no, I’m getting out-of-memory errors! How much memory is my app using? To find out, we go look for a metric that tells us how much memory is available, and we graph it around the time that our errors occurred.


The Cost Crisis in Metrics Tooling
Learn MoreHint: Append them to your structured logs or spans
Before
Oh no, I’m getting out-of-memory errors! How much memory is my app using?
To find out, we go look for a metric that tells us how much memory is available, and we graph it around the time that our errors occurred. Metrics are traditionally stored as time series: every 30 seconds (or 10 seconds, or 5 minutes), check the memory levels and report them. These numbers are fast to aggregate and graph.

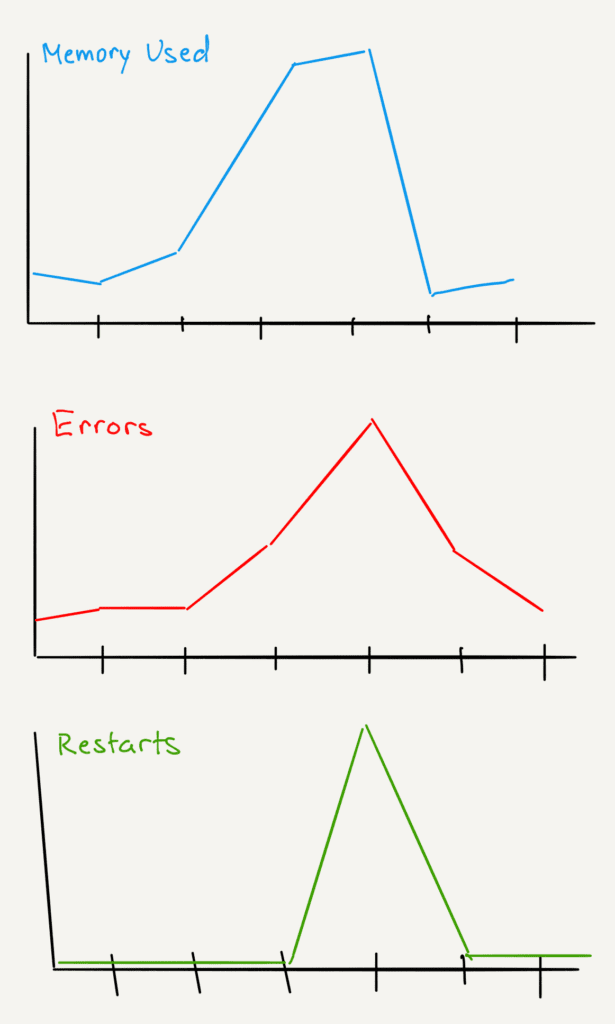
With time-series metrics, we can graph them and look for correlations: like error rate going up as memory usage approaches the available memory limit. Then memory usage goes down suddenly at the same time, the app restarts. We correlate different data sources (error logs, restart events, and the time-series metrics) with our eyeballs.

After
But there is another, better way you can visualize the memory usage at the time of the errors: append it to the structured log.
The error log might look like this:
{ 'timestamp': '2024-09-25 13:55:40.107Z',
  'level': 'ERROR',
  'message': 'Out of Memory Error',
  'stacktrace': '...',
  'service_name': 'product-srv',
  'http.url': '/product/31423123',
  'http.method': 'GET',
  'user.id': 'a432df3',
  'memory.used': 1002343,
  'memory.free': 340,
  'cpu.usage': 0.87,
  'fs.available': 2938412938,
}
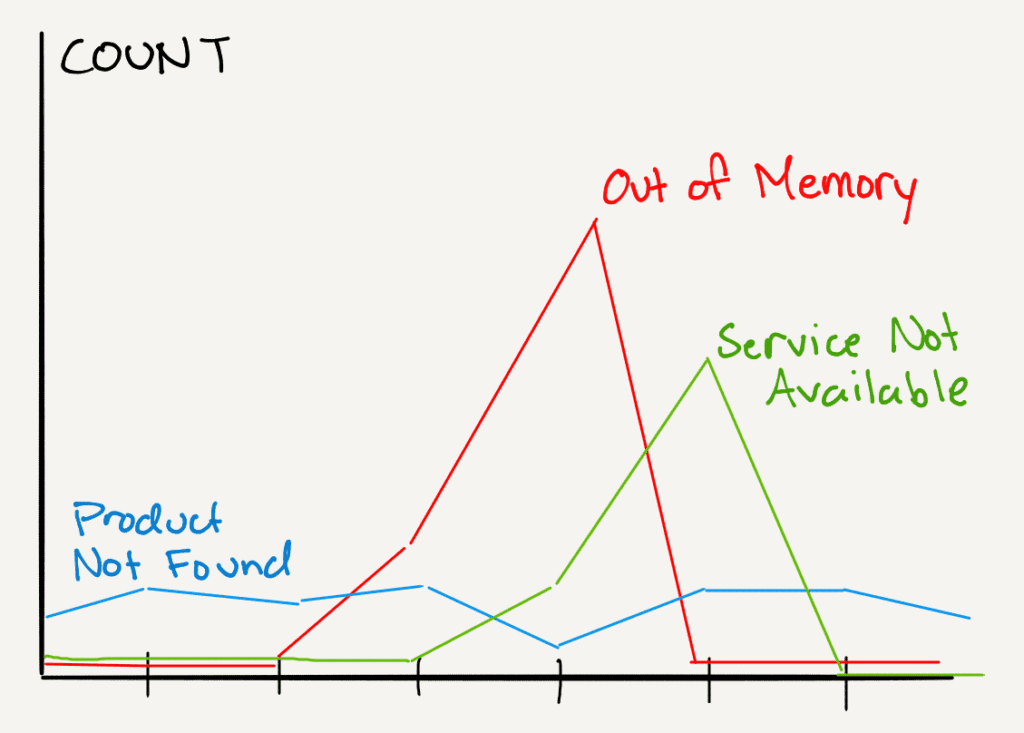
The error is a significant event, so append a bunch of information to it: anything that might someday help describe or identify what happened. While we’re at it, attach memory usage (and other system statistics) to all our structured logs and trace spans! Then we don’t need a separate time series, and we can report the memory level by error message, because they’re on the same record.

How can we get the metrics we need on every log or span?
There are two ways to do this in OpenTelemetry: with a clever Collector configuration, or in the application code.
As a developer, I like to use a SpanProcessor to put metrics on trace spans. This is code that I add to my application.
OpenTelemetry passes every span to my SpanProcessor before sending the span. I get to add attributes, including metrics that I gather from the runtime.
In this Python SpanProcessor, I’m recording the free disk space in /tmp on every span. Find the full code in context here.
class CustomSpanProcessor(SpanProcessor):
  def __init__(self):
    self._disk_usage_monitor = DiskUsageMonitor("/tmp")

  def on_start(self, span, parent_context = None ):
span.set_attribute("app.custom_span_processor.tmp_free_space", self._disk_usage_monitor.get_free_space())That DiskUsageMonitor is a small class in the same file, and it retrieves the free disk space from the operating system once per second at most so that I don’t pester the OS for every span.
There’s nothing stopping me from recording available memory, CPU, and other resources here. The example is minimal on purpose.
Configuring the SpanProcessor is easy in Python. I add this at the beginning of my program:
from opentelemetry import trace
from custom_span_processor import CustomSpanProcessor

tracer_provider = trace.get_tracer_provider() tracer_provider.add_span_processor(CustomSpanProcessor())The procedure to add a SpanProcessor is different in each language. How to retrieve metrics, like available memory and disk space, is different in each language. The concept works in all of them, though: add the infrastructure metrics right where you need them, in application events.
So now, when we have an error, we can ask:
- What’s the available memory?
- What’s the maximum memory usage on successful responses?
- What’s the minimum memory usage while the app is running?
- When memory usage is high, what does latency look like?
It’s all right there. We don’t have to look at a separate data source.
Do we still need the time series?
As long as logs or spans are produced by the application, we can graph the metrics over time. As a developer, I appreciate that when my app is doing nothing, I get no data, and I store no data points. This is optimal in Honeycomb, because every time I record metrics, that’s an event against my quota—while adding metrics to every span is free.
If the goal is to monitor infrastructure, that’s different. Then you want to know that the computer is up even when the application isn’t doing anything. For that, you still need the time series.
This is not a technique for monitoring your infrastructure. Keep using regular metrics, keep minimizing your tags. This is a technique for monitoring what the infrastructure looks like, at the moment each request is being executed. It’s how we handle system metrics in an events-first world.
Is this worth the trouble?
It isn’t enough for programmers to think about code and ops to think about infrastructure. Software engineering blends these perspectives. We move past the traditional recording of metrics per computer, and separately, logs per application. The running code and our hardware resources are interdependent, so get this information together where we can study it!
When metrics are stored as time series, choose carefully the values associated with the metrics. If you tag them by container instance and service endpoint, then you have to store a time series for each combination of possible values. That grows geometrically with the information you add. Each time series costs money.
When metrics are stored on spans, then all the information on the span is immediately available. Endpoint URL (complete with parameters), customer ID, whatever you add. This is not usually relevant to infrastructure metrics… until one particular customer runs you out of memory. In times like that, Honeycomb’s BubbleUp anomaly detection shows you the shocking truth.
Caveat: if your observability platform doesn’t aggregate over values in trace spans, or doesn’t do it fast, or charges a lot to index them—nevermind. The cost savings are gone, and the wait times kill your incident response.
This is why Honeycomb built our own datastore: to make these aggregations unreasonably fast and affordable. Not everyone can do it. But when you can, it’s a powerful tool to understand your system, and it removes the tradeoff of, “What am I going to need to know? What is worth paying to save?” Save it all. Graph it all. Observability 2.0 is a higher standard.
Don’t have Honeycomb yet? Get your free account today.
Want to know more?
Talk to our team to arrange a custom demo or for help finding the right plan.
