Golang as an Observability Tool
Go, for good reason, has become an incredibly popular language for everything from web applications to DevOps tools. We lean on Golang heavily here at Honeycomb, and naturally we are observability nerds, so I got ridiculously excited to use the new pprof web UI to gain more insight into the performance of our Golang programs, both internal and open source.
$ go get
https://t.co/ENQG1r6BP8 to try the new web
UI. #golang pic.twitter.com/QD6NlAXGss— JBD
(@rakyll) August
22, 2017
Let’s talk about using the new web UI to solve an issue in one of our Go programs, honeyelb.
Using the New Golang pprof UI
Recently we announced the new Honeycomb AWS Elastic Load Balancer integration. This is a tool to process the otherwise opaque access logs Amazon gives users to understand the request patterns that are hitting their load balancers. You can now use our open source tool to send this information to Honeycomb for later querying, allowing you to answer questions like “Which servers are performing poorly?” or “When are my applications returning a lot of errors?”.
Lucky for us, when we announced the tool our lovely customers jumped in and started trying it out right away. In the process of doing so, one identified a memory usage issue: the Go runtime was running out of memory and killing the program!
Rather than guess and guess until I identified the source of the issue, I opted to use the new pprof web UI mentioned above to try and track down hotspots. The command line interface to pprof can be a bit unfriendly, but the team is making great strides towards better usability. Let’s take a look at using this to solve an issue.
Installing the pprof Tool
To install the pprof tool with support for the web UI:
$ go get github.com/google/pprof
This provides you with a pprof binary you can use the -http flag with to open an interactive program profile in your web browser. More on that in a second. You may also need to install graphviz, which would be something like sudo apt-get install -y graphviz on Debian-based Linuxes or brew install graphviz on OSX.
After installing pprof, I needed to actually get a profile to work with. Luckily, the Go runtime makes this fairly straightforward with some of the methods built in to the standard library. The honeyelb program is long-running (intended to eventually be used as a set-and-forget daemon), so I added this code into the init block of the main source file:
go func() {
  time.Sleep(120 * time.Second)
  memprof, err := os.Create("mem.pprof")
  if err != nil {
    logrus.Fatal(err)
  }
  pprof.WriteHeapProfile(memprof)
  memprof.Close()
}()
This code spins off a background goroutine (go func()…) which sleeps for two minutes (to allow the program to begin running and accumulate some memory usage for us to later take a look at), then writes a profile of that memory to a file mem.pprof in the working directory where the program is invoked.
Due to the solo colon, pprof should open a web browser automatically pointing towards an arbitrary port on localhost (for instance, it chose :38687 on my machine – you can also specify a port if desired) running the web UI.
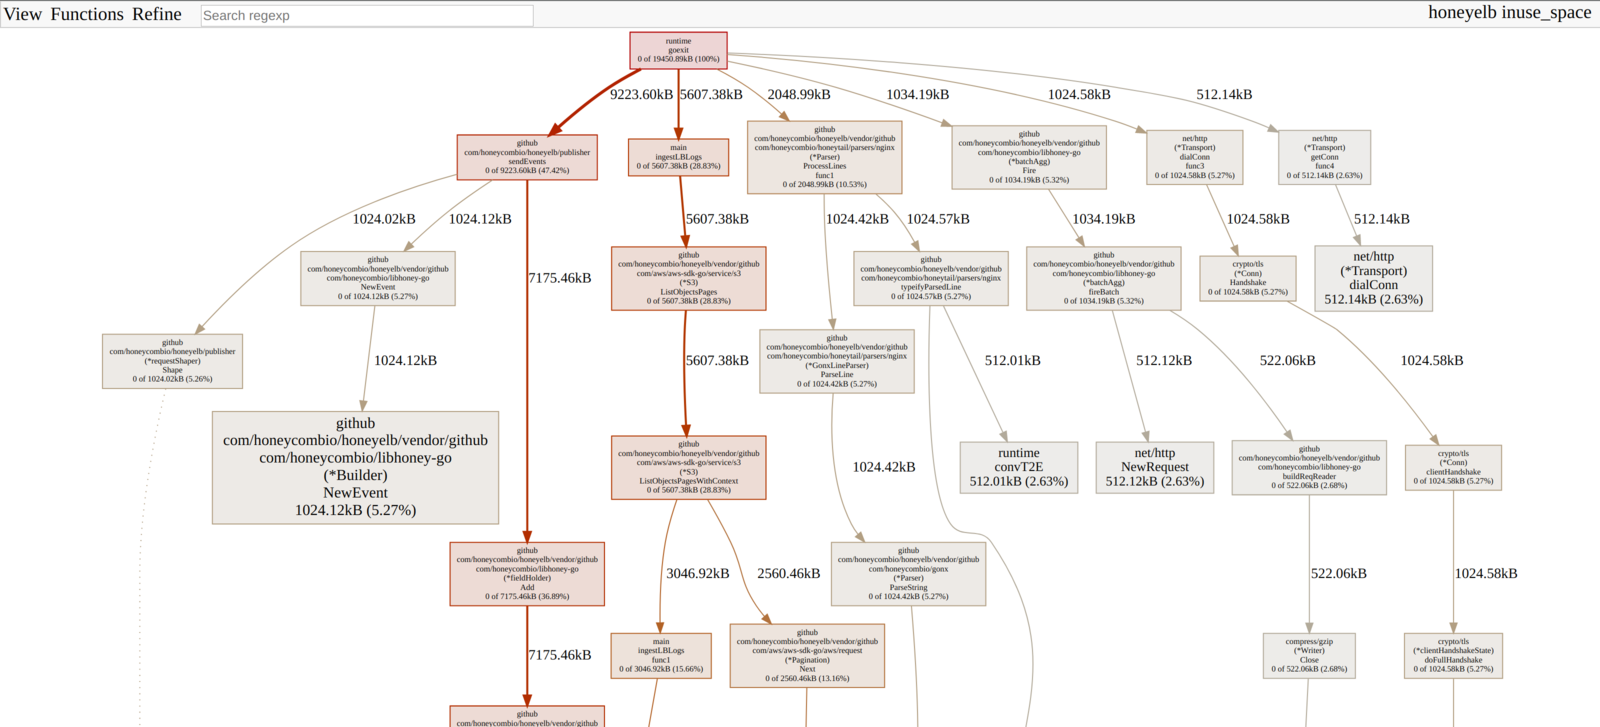
Once booted up I saw something like this:

Generally speaking, the larger a box is, the higher the memory usage of that section of the program is. You can click around in this graph, zoom in and out, etc.
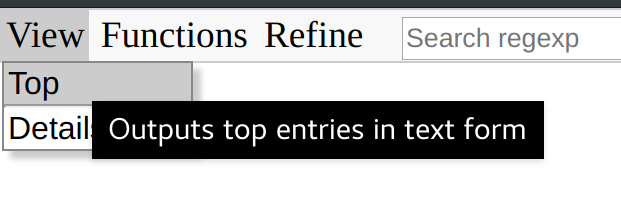
You can see that one box in the above jumps out as larger than the others: it references the NewEvent method in libhoney-go, used to create a new “event” (eventually rendered to JSON blob) to send to Honeycomb. OK, interesting, but how about a numerical / tabular view? We can click View > Top in the upper left hand corner to see this.

This shows us a list of the most memory-intensive functions in the program, sorted by flat usage.

Looking at the numbers in the Flat % column, we can see that runtime.hashGrow and runtime.mapassign (internal Golang methods related tomap usage) are clearly the most memory intensive.

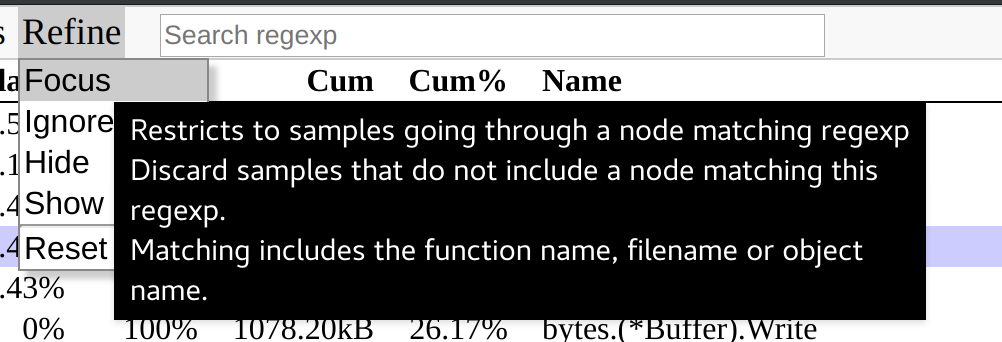
So, we are clearly eating up memory in maps, and libhoney.NewEvent seems a likely suspect for why. How can we verify this? One way is to highlight the greedy methods like shown above, and click Refine > Focus to narrow down our list of functions to the ones in the code path for this map usage (i.e., for the highlighted methods).

Once I dug down into this level of detail, I did indeed confirm thatlibhoney.NewEvent was a noteworthy source of increased memory usage. Knowing that this was the greedy method, I started to reason about which code paths would lead up to it. In doing so I realized that we were spinning up an excessive number of Publisher structs (used to “publish” the events parsed from the ELB access logs to Honeycomb) when we only needed one. Therefore I made this change to only spin up one. I hadn’t noticed the memory inflation in my local testing, but putting the program through its paces made the issue clear.
A new pass through the profile reveals that memory usage is now saner, andruntime.makechan and bytes.makeSlice are our new foes in that regard. However, pprof can help us understand that this seems related to JSON marshaling and is something that’s likely a bigger task to fix (if it becomes a problem that needs fixing at all).
pprof UI and the Observability Mindset
Tools like this new pprof web UI really highlight the importance of an “observability mindset”. It’s becoming increasingly difficult to reason about what’s going on inside our systems, and tools like Honeycomb are emerging to help combat the fog of war. By reducing our unknown unknowns to knowns (or at least known unknowns), we can be prepared to fix issues proactively rather than when things are on fire. And we can, of course, be a lot more prepared for unforeseeable problems when they inevitably come up.
Many thanks to rakyll and the rest of the Golang team for their great work! I’m looking forward to seeing more in this area such as a built-in flame graph implementation.
Until next time, observe all the things! And please do sign up to try out Honeycomb (for free!) if you haven’t already. 🙂


