This guest blog post is by Or Weis, Co-Founder and CEO of Rookout, the Rapid Debugging Company. He’s a low-level engineer and a CybSec Expert.
You probably know that Honeycomb is the most flexible observability tool around. Its powerful high-cardinality search makes working with real raw data quick and easy. But as you may have learned through hard experience, fetching those dots can still be quite a challenge.

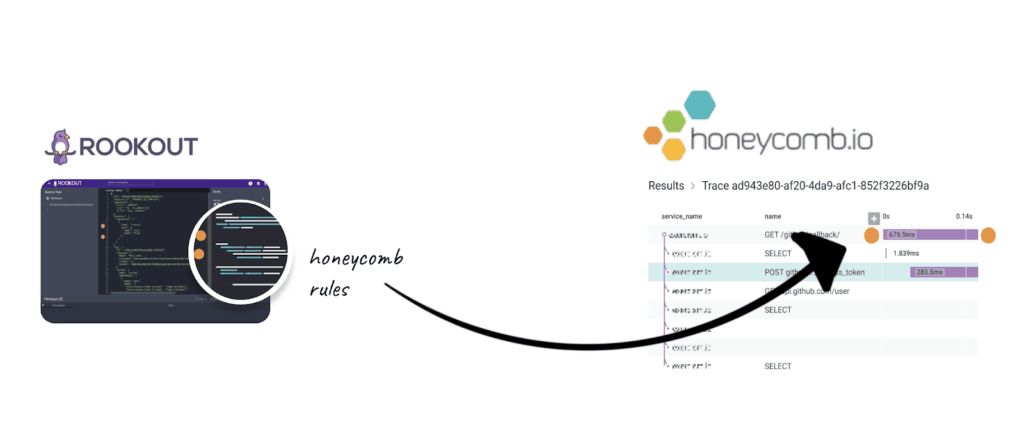
That’s why we are excited to share the news about Honeycomb’s partnership with Rookout, a rapid live code debugging solution. This integration makes it easy for engineers to set up a tracing set for their application code on demand, to any depth, with the click of a button.
Rookout lets you set non-breaking breakpoints to collect any data you want from your live code, and have it delivered on the fly to Honeycomb (and wherever else you need it, such as your database and alerting systems). Without adding code, and without restarting or re-deploying. Now you can send the data “dots” that you need — a specific variable, the entire stack, or a trace span — directly to Honeycomb, and start tracing away.

Combining Rookout’s on-demand data collection with Honeycomb’s flexible data aggregation capabilities creates a valuable end-to-end observability pipeline that can eliminate much of the friction and pain we all face when debugging live data in the brave new dev environments we use today. If you want to try the integration yourself, check out our tutorial at the Rookout Git Repository.
The tidal wave of change that software development tools have undergone in the past few years is nothing short of staggering. We are thrilled by the new challenges these changes bring to the worlds of debugging and observability. Honeycomb and Rookout are both spearheading those efforts, and together, are making great strides toward making debugging easier for developers, devops, and engineers.


