Note: this is the first in a series of guest posts about best practices and stories around instrumentation. Like it? Check out the other posts in this series. Ping Julia or Charity with feedback!
This is the very basic outline of instrumentation for services. The idea is to be able to quickly identify which components are affected and/or responsible for All The Things Being Broken. The purpose isn’t to shift blame, it’s just to have all the information you need to see who’s involved and what’s probably happening in the outage.
In a total abstract void, you have a service.

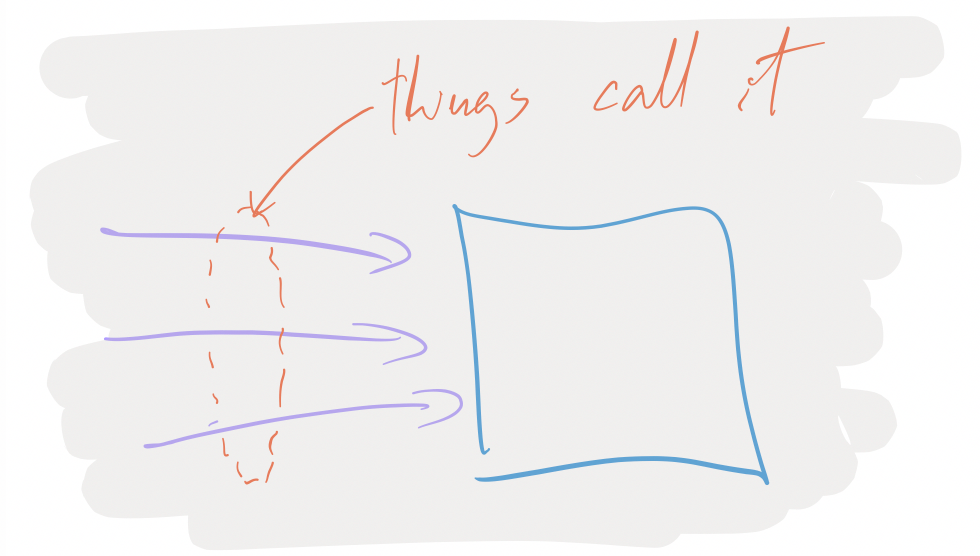
Things are calling your service, be it browsers from the interweb, or other services, or API clients from the interwebs: upstream things are depending on you.
Most of the time, your service will have dependencies on other downstream things: some database or other service.
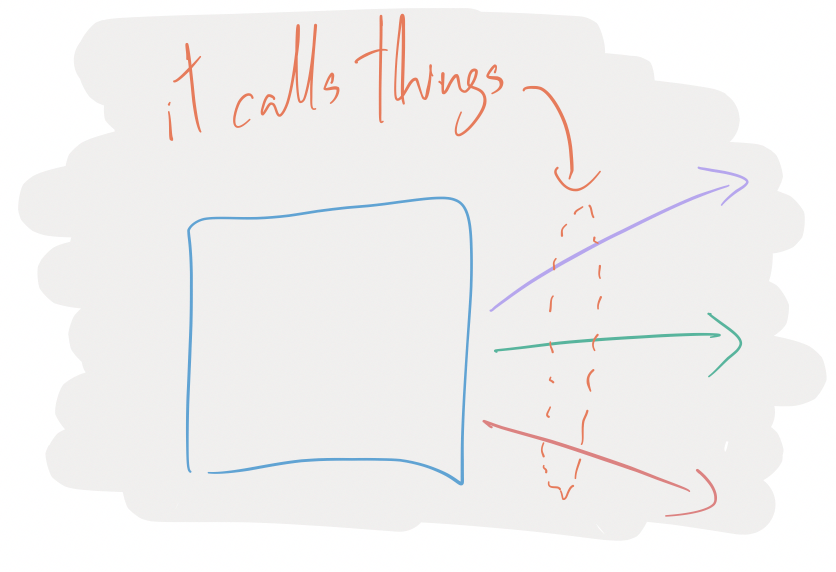
And when there’s problems happening, people from Upstreamland will be telling you about your broken service, and you’ll, maybe, turn around and blame people in Downstreamistan:

But somehow, you need to be able to know when something is your service’s fault, or someone downstream’s fault. To do that, when people tell you that your service is broken, you need to be able to see if internally, it appears to be broken.
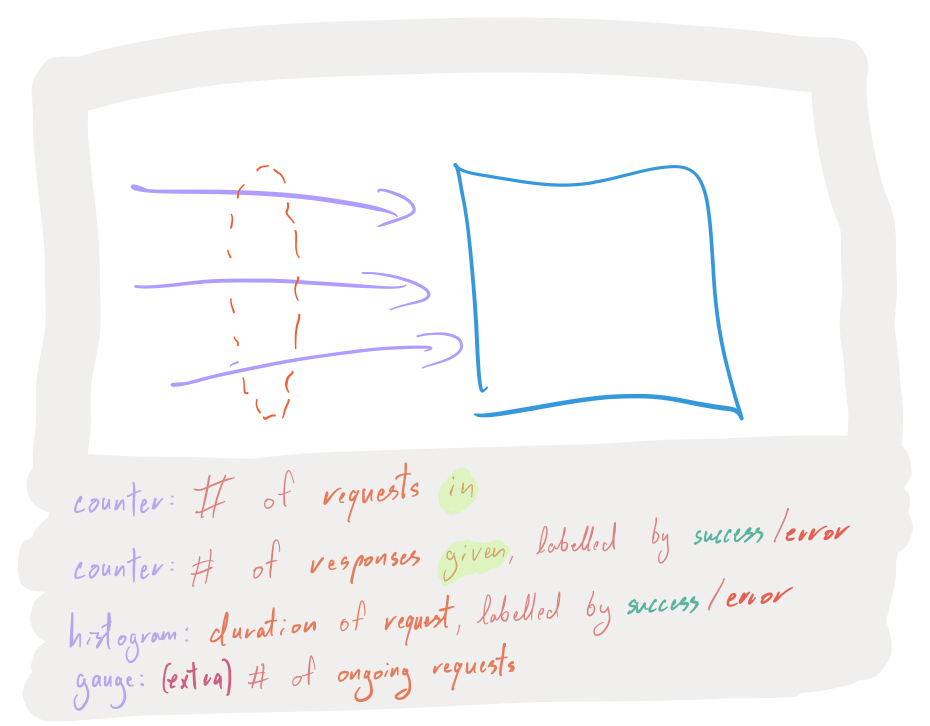
For all incoming requests, you want to have the following instrumentation points:
- A counter that is incremented for each request that you start serving.
- A counter that is incremented for each request that you finished serving, aka responses, labelled by successes or errors.
- A histogram of the duration it took to serve a response to a request, also labelled by successes or errors.
- If you feel like it, throw in a gauge that represents the number of ongoing requests (helps identify leaks, deadlocks and other things that prevent progress).
With this information, when people tell you that your service is broken, you can prove or disprove their claims:
- Yup, I can see the problem:
- my thing is returning lots of errors, very rapidly.
- my thing is returning few successes, very slowly.
- my thing has been accumulating ongoing requests but hasn’t yet answered them.
- Nope, problem is before me because my thing hasn’t been receiving any request.
This gives you many dimensions to prove or disprove hypothesis about what’s happening.
If it seems like your service is involved in the problem, the next step is to know: is it strictly my fault, or is it a problem with my downstreams? Before you turn around to other people to tell them their things seem to be broken, you need numbers:
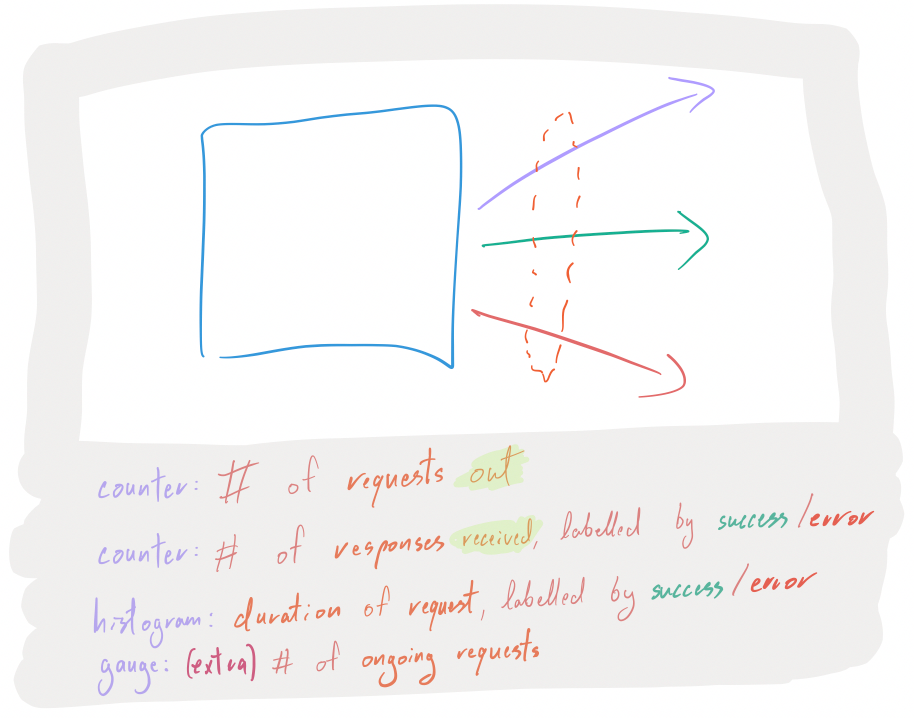
For all outgoing requests (database queries, RPC calls, etc…), you want to have the following instrumentation points:
- A counter that is incremented for each request that you initiate.
- A counter that is incremented for each request that had a responses, labelled by successes or errors.
- A histogram of the duration it took to get response to a request, also labelled by successes or errors.
- Again, maybe throw in a gauge that represents the number of ongoing requests (helps identify stuck calls, or build ups of thundering-herds-to-be).
And now, you can see quickly whether the reported problem lies within your service or within one of its dependencies.
I talked about services, databases, API clients, the browsers on the interwebs… this principle is valid for any individual piece of software that’s in some sort of client-server shape, be it:

a monolithic Rails application with a SQL DB, some Redis and what not… that’s alone serving requests from the webs, or:

An organically, loosely organized set of DBs and web services, or:
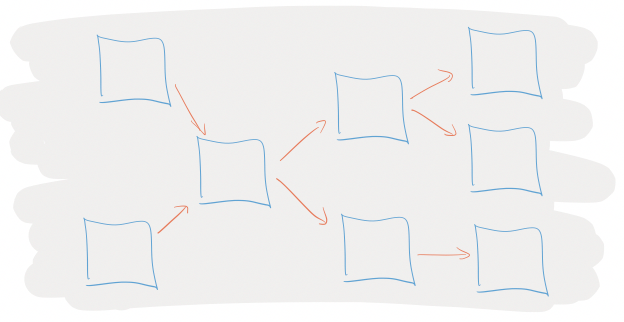
A massively distributed microservice soup.
In Instrumentation 102, we will see how to instrument the internals of a service. Due to budget constraints, Instrumentation 102 has been indeterminately postponed.
Thanks again to Antoine Grondin for their contribution to this instrumentation series!


