RUM can leave questions unanswered.
Honeycomb for Frontend Observability doesn’t.
Today, we’re announcing the early access program of Honeycomb for Frontend Observability.
Honeycomb for Frontend Observability gives teams the ability to quickly identify opportunities for optimization within their web app. This starts with better OpenTelemetry instrumentation, available as an NPM package, that lets you instrument and collect attribution data on Core Web Vitals in under an hour.
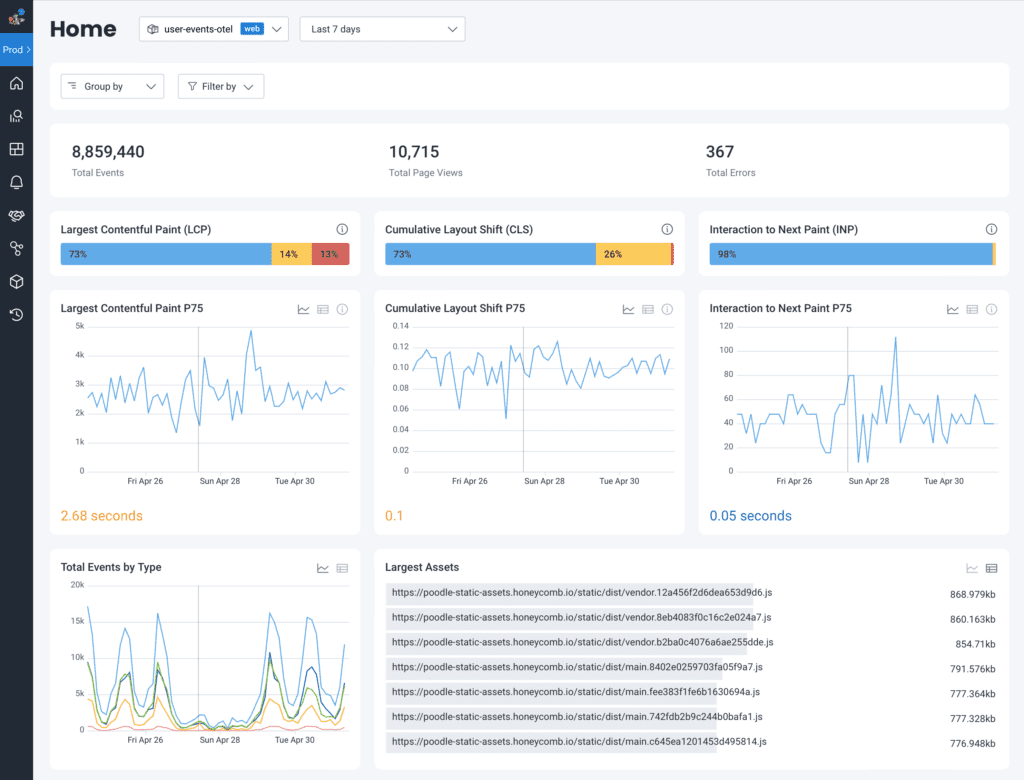
With the new Web Launchpad in Honeycomb, you can drill into your site’s Core Web Vitals to see exactly what triggers poor scores, see full stack traces, and explore other performance data. You’ll also have Honeycomb’s full suite of powerful data analysis features for frontend datasets like BubbleUp, Service Map, and SLOs. These features help you quickly resolve issues, make data-driven performance improvements, and improve overall customer satisfaction.

Modern web applications are built on client-side frameworks like React that rely on asynchronous data fetching and dynamic content updates without full page reloads. These application patterns are not easy to debug in products like real user monitoring (RUM) solutions, which were built to monitor initial page load metrics.
RUM solutions limit your ability to add and query on all of the critical information around customer journey touchpoints like registration, subscription, or purchase completion. RUM vendors do this by making those custom attributes expensive, pre-aggregating them so you can’t drill down, and limiting their retention so much that it’s impossible to do meaningful trend analysis. This reduces the usefulness of RUM tools for investigations into customer and performance issues.
Honeycomb for Frontend Observability removes these barriers by making it easy for you to collect the instrumentation you care about and easily explore data to find new insights.
Eligibility
The Honeycomb Web Instrumentation package is open source and is available for anyone to use.
The early access program for the new Web Launchpad view within Honeycomb for Frontend Observability is available to current and prospective customers on Honeycomb Enterprise plans. You can contact your Honeycomb Customer Success Manager if you are interested, or you can fill out this form.
Web-ready OpenTelemetry instrumentation
With Honeycomb’s OpenTelemetry wrapper, teams with no OpenTelemetry experience can instrument their frontends. Out of the box, it collects Core Web Vitals data with attribution alongside standard performance data to give developers clear answers about what they need to address to increase their scores, along with a host of other data that is not collected by OpenTelemetry’s web auto-instrumentation.
Because you’ll be sending this data to Honeycomb, custom attributes, including data like session IDs from other tools like Sentry or FullStory, are free to add thanks to Honeycomb’s wide events. And with trace header propagation, teams will also be able to leverage end-to-end tracing to locate where issues are occurring—whether in the frontend or the backend—to streamline cross-team collaboration.
Improve customer satisfaction by measuring real user journeys
Many teams have product analytics tools that focus on user funnels (how many people get from A to B) but these tools are built for non-technical users. This means they only provide metrics on user actions, no deeper context.
Developers can’t improve UX flows unless they can understand how the code and UI impact them. This requires contextual data:
- What was on the page?
- How long did it take to load?
- Did an interaction, such as a click, result in a long wait?
To perform these types of investigations, you need to be able to query contextual event data, something traditional RUM tools aren’t able to do.
With Honeycomb for Frontend Observability, clicks are tracked out of the box, and context is free to add. Developers can capture anything that would improve their investigations like app state or user info.Then, once they have a hypothesis, any of that context is available to query for up to 60 days, with no pre-aggregated data. Using Query Assistant, they can build queries in plain English without any query language experience.
This means that everyone, from the intern to the most experienced members of your team, can quickly get to the information they need, including where an issue originated. Alongside the visualizations are full stack traces which allow you to follow a user’s requests from the browser through all of your services. This gives teams the ability to answer questions not only about their own code, but the entire system so they can work faster on cross-disciplinary teams, have greater confidence in their deployments, and drive alignment.

Better SEO and site performance
While Google has tools that let you see a given page’s average Core Web Vitals, there is very little other debugging information available to reveal what made it bad, making it hard for engineers to know where to look when attempting to improve their scores.
RUM tools don’t include attribution data out of the box with Core Web Vitals because of cost and limitations within the tools themselves. The volume of contextual data that affects scores is high for most organizations, making it cost-prohibitive in those vendors’ ingest volume pricing models. They also aren’t designed to handle querying of high-cardinality (high context) data and rely on pre-aggregation.
The Honeycomb Web Instrumentation package captures attribution data with Core Web Vitals, which is the data that explains the cause of the poor metric. This attribution data is a much better signal for understanding the causes of poor scores, allowing developers to know exactly what they need to do to fix to improve their scores.
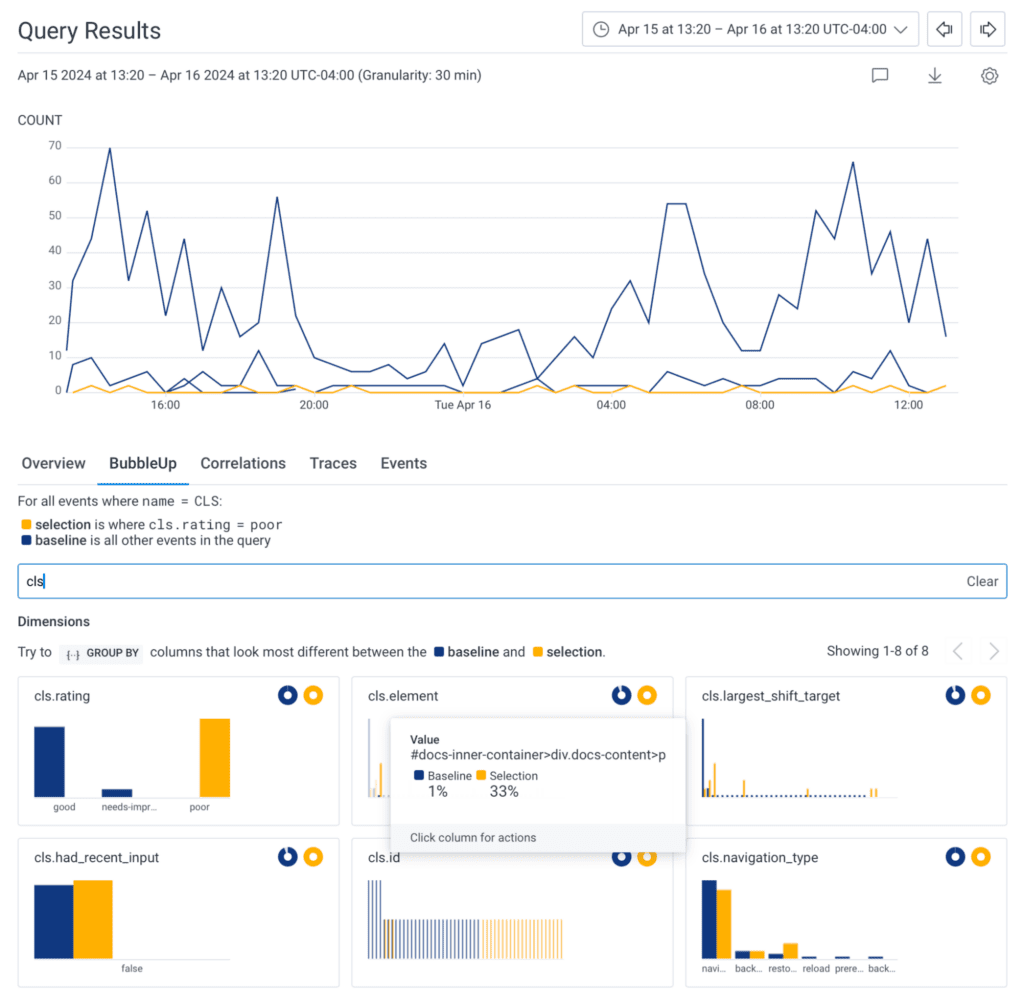
Then, with Honeycomb’s BubbleUp, a developer can—right from the Web Launchpad—investigate what’s different about Core Web Vitals marked Poor vs other ratings. BubbleUp will surface the important data, like page URLs and elements, that correlate to Poor rankings so developers can prioritize their investigations and quickly build hypotheses.

Reduce MTTR for frontend issues
RUM dashboards give a big picture view with lots of helpful visualizations and high-level metrics, but are unhelpful for debugging unless the data behind the visualizations can be filtered down.
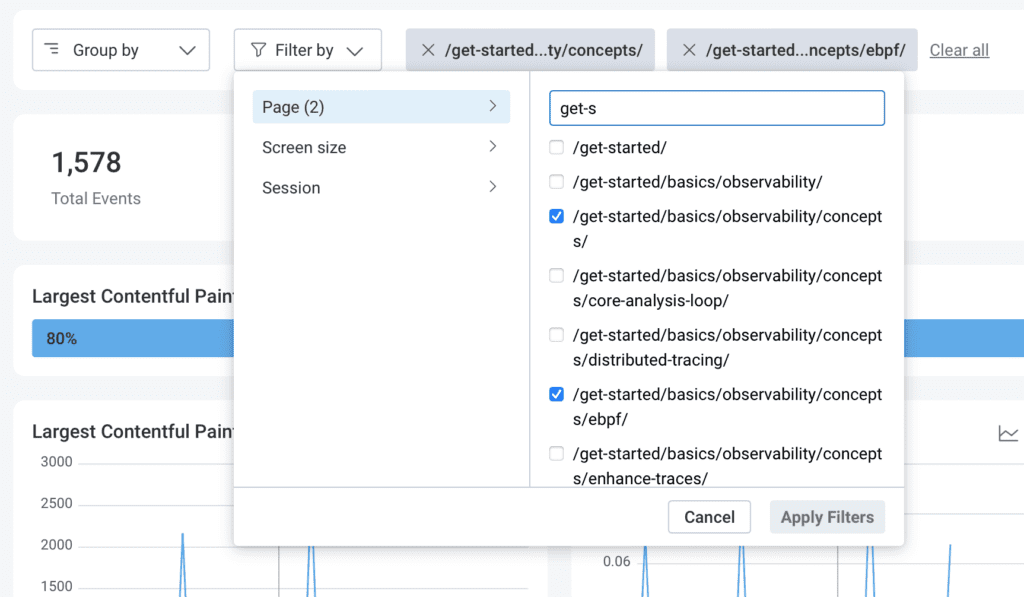
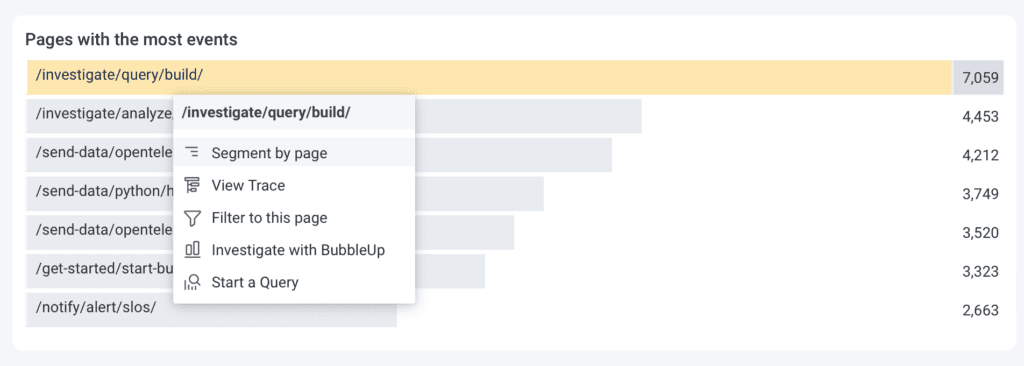
With Honeycomb for Frontend Observability, every metric is associated with a rich set of context from high-dimensionality and high-cardinality data, capturing the finest minutiae of requests within wide events. Our Web Launchpad allows you to Group By standard or custom high-level categories (Page, Device Type). From there, developers can easily get down to a specific page or device type. Doing so will update every visualization to that scope, and each visualization leads to a full Honeycomb query, so it’s easy to iterate and ask the right questions. Those less comfortable with querying can slice and dice their data in complex ways with Honeycomb’s Query Assistant, making it easier for all team members, no matter their knowledge of the system, to identify issues and what needs to be fixed.

Get started today
To learn more about the Honeycomb Web Instrumentation package, check out the GitHub repo or our documentation.
To join the Early Access program, reach out to your Honeycomb Customer Success Manager to let them know that you would like to be flagged into the program. Or, simply fill out this form.


