OpenTelemetry Is Not “Three Pillars”
OpenTelemetry is a big, big project. It’s so big, in fact, that it can be hard to know what part you’re talking about when you’re talking about it! One particular critique I’ve seen going around recently, though, is about how OpenTelemetry is just ‘three pillars’ all over again. Reader, this could not be further from the truth, and I want to spend some time on why.

By: Austin Parker

The Director’s Guide to the Future of Observability: AI, OpenTelemetry, and Complex Systems
Learn MoreOpenTelemetry is a big, big project. It’s so big, in fact, that it can be hard to know what part you’re talking about when you’re talking about it! One particular critique I’ve seen going around recently, though, is about how OpenTelemetry is just ‘three pillars’ all over again. Reader, this could not be further from the truth, and I want to spend some time on why.
What are “three pillars,” anyway?
Let’s get it out of the way: when people talk about “three pillars,” it’s usually in a pejorative sense. Someone’s about to tell you that the way you’re doing things is wrong, because of some narrowly constructed set of criteria and circumstances that they’ve built up in their mind.
Let’s tease it apart then, yeah? “Three pillars” is generally used to refer to the idea of three separate telemetry signals—metrics, logs, and traces. These three signals have different structure, semantics, and use cases, and they’re typically viewed in isolation from one another.
The eagle-eyed amongst you might have noticed a clever rhetorical trick I just employed in that last statement. I made an implicit comparison between the telemetry and the workflow, conflating the two of them. This is a pretty common argument, especially in the observability world. The reason it has so much staying power is because it maps well to people’s experiences of using telemetry data, though. You use metrics in a different way than you use logs, and you use traces in a different way than you use metrics.
For years, this separation has been more or less enforced by the tools we’ve built as an industry to consume and analyze this data. Metric workflows usually center around alerts, log workflows center around search, and trace workflows center around the end-to-end visualization of a request. I would argue that for the most part, this is how most people tend to see the broad contours of the observability space.
Watch Austin’s webinar, The Director’s Guide to Observability: Leveraging OpenTelemetry for Success.
What does the “three pillars” world look like?
OpenTelemetry is, clearly, oriented around creating these same “three pillars” signals of metrics, logs, and traces. I don’t think I’d blame you for looking at it and saying that it’s just rehashing the same things that have come before. What I want to do now, though, is tease apart the difference between a signal and a workflow. Bear with me for a minute, and this will start to make sense.
When you create a log statement, what are you actually doing? What does that log statement represent? Fundamentally, it’s a human-readable representation of system state at an instantaneous moment in time. An event occurred, here’s what that event was. This works great at first, until you have more than one person involved in your software. Now, you need ways to structure that event and make it legible to many consumers—other people on your team, end users, system operators, security teams, etc. Structured logs to the rescue! Instead of haphazard strings, you can emit nicely formatted JSON objects with known keys and values.
As your software grows in size, scope, and complexity, you begin to run into cases where these nicely formatted structured logs are insufficient. Perhaps it’s because the logs record things that are very important, but only as an aggregated count of those events—for example, the number of server errors on a HTTP server. You also usually have more business-y questions that don’t need the full fidelity of every event in order to answer. The number of new account signups, for instance, and what part of the world they’re coming from. The rate of videos being uploaded, and their average length. Yeah, these are things you can derive from your structured logs, but… why should you, if you know you need to know them? Metrics arrive to save the day, giving you a cheap and efficient way to track numeric values over time.
This leads to another question, though: how do you get these metrics to begin with? If the data you need is in your existing structured logs, you can do most of these calculations at query time, giving you more flexibility. This comes with tradeoffs, as everything does, which leads many people to pursue implementing metrics as a separate application-level signal type entirely. A side benefit of this approach is you can collect other useful metrics, like “How much memory is my application using?” or “How long does garbage collection take?” often with the same metrics library.
Download our guide and see the power of Honeycomb + OpenTelemetry together.
A new problem appears—but so does a solution
As your application continues to grow, you encounter a new problem. Your metrics are great at alerting you about potential problems, and your logs are great for digging in and pinpointing why something is wrong, but they’re getting harder and harder to use. The number of nodes, pods, or other places that your code is running continues to expand. Log search takes longer and longer as you have to sift through progressively more data. The ugly side of metrics rears its head through the dreaded cardinality explosion caused by having too many unique values for a metric attribute. Your alerts tell you that there’s maybe a problem somewhere, but trying to actually sift through the reams of logs makes it really challenging to figure out why the alert is even firing. It’d be great if you had a way to understand the entire path of a request from client to server… some sort of way to manage the performance of an application with many services.
Traces are here to help you out.
Traces mean you can view the end-to-end performance of an application and really understand not just what part of a request is slow, but why. It gives you the best of both worlds in many ways: spans have a duration, as well as structured metadata. You know not just how long it took to make a database query, but what the parameters to that query were. Even better, you can look at that query in the full context of a request; you know exactly what server processed it, in what region, running which version of your service.
This is, in a nutshell, the “three pillars” worldview that I described above. Logs contain a bunch of information you can search through, metrics are your first-line alerting source, and traces let you synthesize the two at a per-request level. These workflows are, more or less, independent of each other in this model. Your metrics, logs, and traces all exist independently of each other, with no explicit connective fabric between them.
Bridging the “three pillars”
It is a fairly well-worn trope by now that insurgent observability tools rail against this “three pillars” mindset by conjuring up a world of fruitless, disconnected investigatory loops where data is siloed between differing data stores with different query semantics. Much of this is correct, but is it true? I would argue that it is not, in many cases. There are two reasons for this:
- Observability tools work very hard to create unified (or “single pane of glass”) experiences around telemetry data by building bespoke workflows on top of independent signals.
- As long as you’re staying inside one specific tool, it’s possible to overcome the lack of explicit context by imposing a write time schema.
Let me break those down a bit.
If you’ve used New Relic, Datadog, Sentry, or pretty much any other commercial observability platform, then you’ve benefited from integrated workflows. Datadog will gladly display beautiful pre-built dashboards that integrate metric, log, and trace data into a single view that highlights errors and areas of concern. These are useful and easy to get started with. They’re the real value-add of a commercial observability solution for most people!
This goes hand-in-hand with my second point: the only way to produce those integrated workflows, in the absence of standards, is by creating contextual links between telemetry signals when the signals are created. If you use the Datadog or New Relic agents, those agents are adding useful (and standardized) fields to your telemetry that can be consumed by the service to build those aforementioned dashboards and alerts. Even better (for the toolmakers), having a broad set of ‘known knowns’ means their engineers can ruthlessly optimize the query and storage paths for those signals, allowing them to reap economies of scale as they onboard new customers.
The problem with this model is that it’s brittle. What happens if you’re dissatisfied with Vendor X, and would like to change? Well, I hope you didn’t like those default dashboards, because they aren’t coming with you. Beyond that, you’ve probably got hundreds or thousands of engineering hours invested in upskilling teams to work with your incumbent product. All of that knowledge disappears when you switch.
There’s a fundamental lesson here about value, I think. Treating observability as a second or third order effect of systems leaves you vulnerable to this kind of trap where you don’t actually know what’s going on, you just parse it through the lens of a vendor. You’re subject to their biases, business model, and suppositions about how you should use the tool. You’re also captive to their model of innovation—it’s hard to push things in a new direction if your entire observability stack is oriented around someone else’s business model. To be more blunt, a vendor is going to make the decision that’s best for them, not for you.
OpenTelemetry answers the question implied by this problem statement—the question of “So, how do we change things?”
OpenTelemetry is more than “three pillars”
If you read the OpenTelemetry specification, the first thing you’ll see is this image. It shows signals resting atop a common layer of distributed context. This is important! It’s probably the most important thing to understand about OpenTelemetry. It drives every decision that the project makes. OpenTelemetry, fundamentally, unifies telemetry signals through shared, distributed context.
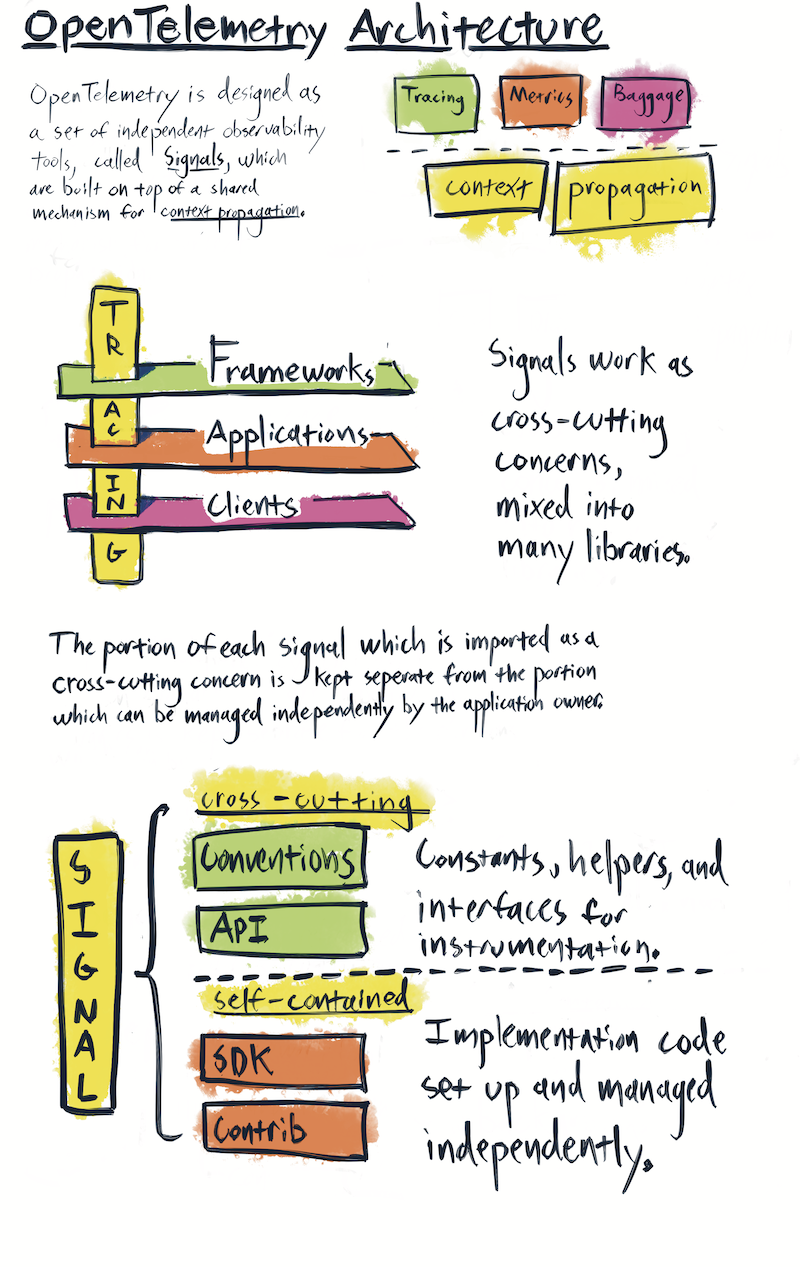
Now, an important caveat. The project doesn’t require you to do this. Each signal is usable more or less independently of the other. If you want to use OpenTelemetry data to feed a traditional ‘three pillars’ system where your data is stored in different places, with different query semantics, you can. Heck, quite a few very successful observability tools let you do that today! I believe the single biggest reason that people don’t grok the value of OpenTelemetry is that most people don’t build products that support OpenTelemetry.
Here are a few things that the shared context layer allows you to do in OpenTelemetry:
- Dynamically adjust how much data is collected, and where it goes, based on different signals. For instance, using metrics to inform a trace sampler to sample more data from a particular service based on the measured error rate of a given API.
- Create dynamic feedback loops of instrumentation where instrumentation libraries can turn themselves on and off based on system state, error rate, latency, or other measures.
- Store-and-forward different resolutions of data at different sinks in a telemetry pipeline, reducing the amount of data that’s exfiltrated from a system during normal operation while allowing operators to easily discover the current location of telemetry when they need to know it.
- Tie together telemetry sources from infrastructure, frameworks, libraries, business logic, and customer analytics—even if they live in different systems of record.
This isn’t just “three pillars but with some standards on top,” it’s a radical departure from the traditional “log everything and let god sort it out” approach that’s driven observability practices over the past couple of decades.
Ok, so where’s all that stuff you just talked about?
I don’t have a great answer for you here other than change takes time. There’s a difference between “things that are possible” and “things that are achievable,” and in OpenTelemetry, the delta between these two points is very high. The reasons for this are varied, to say the least. One very powerful reason is that it’s hard to generalize these solutions into products—in other words, if it was easy, we’d have done it already.
Another reason is that observability is, in many ways, a nascent field. Like I said earlier, many people get a lot of value just from having some standard dashboards and alerts! This is also a bit of a self-fulfilling prophecy; because observability isn’t seen as a critical part of systems development, it tends to be treated as an operational afterthought. Decisions are made on cost, not necessarily value. Practically, “testing in production” remains a punchline rather than useful advice for most developers across the world.
Does this mean that we’re trapped in samsara, an endless cycle of ‘good enough?’ I don’t think so, no. OpenTelemetry is already changing the observability landscape by commoditizing high-quality, vendor-agnostic, highly contextual telemetry streams. New entrants into the (very crowded) observability tool space are popping up far more frequently than they were before. It’s inevitable that we’ll continue working to solve these problems, and new breakthroughs will continue to reshape the art of the possible.
I’d like to leave you with some thoughts, then, on how to think about telemetry signals in the OpenTelemetry world.
Rather than thinking about signals as streams of data, think of the signal itself as a type. It’s a classifier for a stream, and that classifier is very important. It’s important as a developer, because it’s a signal of intent.
If you’re emitting a metric, then you’re emitting it for a reason—you know that it represents a ‘known known,’ a value that changes over time, with a constrained set of values. It’s something that you know you’ll want to keep track of over a long period of time, most likely.
If you emit a span, there’s also a reason for it. The span represents something that has a duration, and is interesting. It’s not just a function call, it’s a unit of work that you can aggregate on that has some sort of implication on performance. Maybe the implication is that you’re responsible for the performance (e.g., it’s an RPC that rolls up into a service level objective that your team is graded on, or it’s a customer-facing request, or it represents a business transaction), or that it’s part of a larger request that you need to understand the shape of.
Similarly, a log event is also intentful. It’s something that happens instantly that doesn’t necessarily happen within the context of a larger request. It’s a marker, or an error, or another type of occurrence that you want to know about. It’s important that a telemetry API has the expressiveness to define these intents, because they’re also important for people building observability tools!
Knowing that a metric is a metric has some really important implications for data storage and query engines! Knowing that logs are instant and that they have a defined structure has implications for how those logs can be compressed and what sort of affordances we should build for you to query them. Spans have similar constraints and optimizations: knowing that spans are part of a trace has implications for how those traces are stored and how they can be visualized.
Please note that I’ve actually completely elided another important part of OpenTelemetry’s distributed context—the entire concept of resource attributes, and how they play into this stream of data. If you’d be interested in reading about it, let me know!
Want to know more?
Talk to our team to arrange a custom demo or for help finding the right plan.