Is OpenTelemetry Open for Business? September 2024 Update
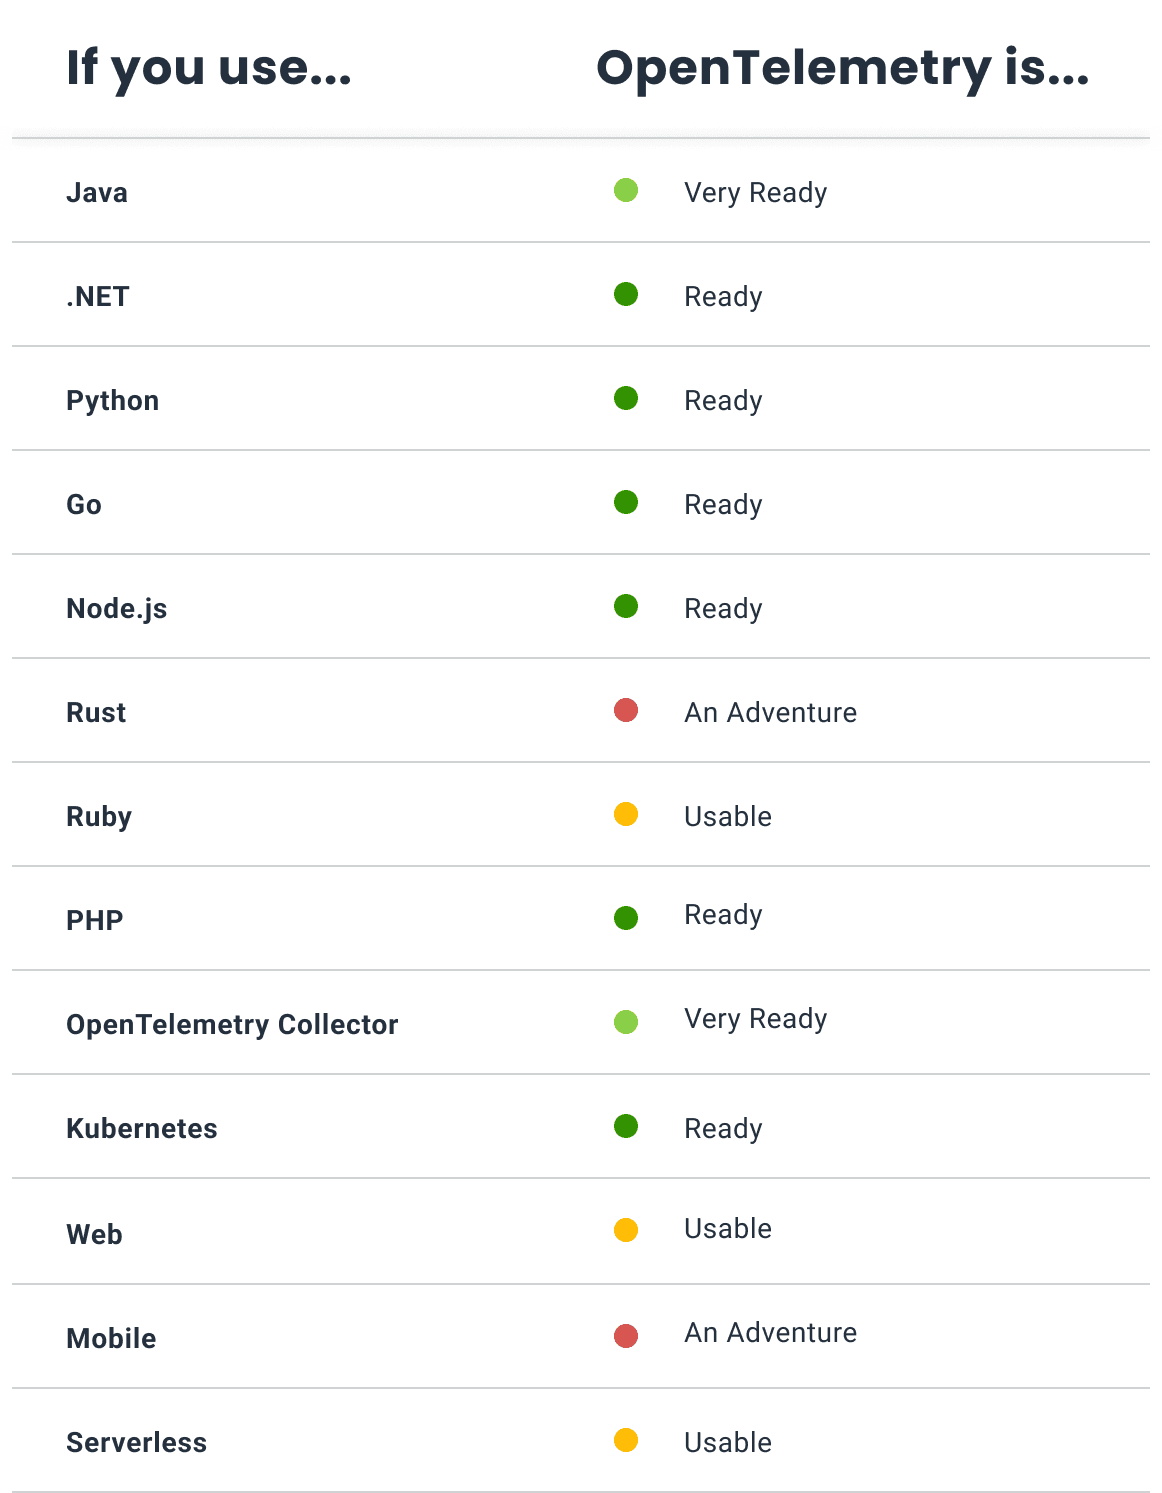
One of the things about OpenTelemetry that’s easy to miss if you’re not spending the whole day in the ins and outs of the project is just how much stuff it can do—but that’s what I’m here for! Today, I want to go through the project and give you a guide to the various parts of OpenTelemetry, how mature they are, and what you can expect over the next six months or so. I ranked these elements by relative maturity across the entire project. As such, the stuff marked ‘very ready’ is the most stable, while the stuff marked ‘an adventure’ is less stable. Let’s dive in!

By: Austin Parker

How OpenTelemetry and Semantic Telemetry Will Reshape Observability
Learn MoreOne of the things about OpenTelemetry that’s easy to miss if you’re not spending the whole day in the ins and outs of the project is just how much stuff it can do—but that’s what I’m here for! Today, I want to go through the project and give you a guide to the various parts of OpenTelemetry, how mature they are, and what you can expect over the next six months or so. I ranked these elements by relative maturity across the entire project. As such, the stuff marked ‘very ready’ is the most stable, while the stuff marked ‘an adventure’ is less stable. Let’s dive in!
Tier 1 OpenTelemetry stability
Here’s the most important—and, generally, most stable—stuff. Things can (and sometimes do) change, but most of the time you’re looking at elements that will be supported for years to come, and that work rather well out of the box with some light tuning.
Application tracing, metrics, and logs
OpenTelemetry supports 12 different languages for instrumentation, and offers out-of-the-box traces for all of them. If you use gRPC or HTTP clients and servers, you’re good to go—all the basics are there, and you’ll get complete end-to-end traces of your services. Metrics and logging at the SDK level are starting to flesh out more as well, depending on which language you’re using. Java, .NET, Python, and NodeJS are really the standouts here, with hundreds of integrations supporting all three core signals. In addition, you can extend this instrumentation with your own custom telemetry by using the OpenTelemetry API.
Infrastructure metrics and logs
The OpenTelemetry Collector supports dozens of log and metric sources—everything from journald to Docker and back. If you need telemetry from MySQL, GCP, Azure, AWS, or any other kind of infrastructure source, there’s probably a receiver for it.
Telemetry processing
If you need to transform your telemetry (turning traces into metrics, removing PII, de-duplicating logs, or almost anything else), then OpenTelemetry has something for you. The Collector offers processors for grouping, filtering, sampling, redacting, and much more. While some of these components are marked ‘alpha,’ that shouldn’t necessarily scare you off—they work very well!
Tier 2 OpenTelemetry stability
Things in this section have a bit more churn to them; they are more experimental and unstable, but will be hitting their stride soon enough.
Semantic Conventions
The OpenTelemetry Semantic Conventions are essentially a set of standard metadata about telemetry. For example, if you have an HTTP server, the conventions spell out what attributes you should have for each request, what they’re named, and what the values can be. Things like “how do I represent an HTTP status code,” or “how should a request path be formatted.” Some of these conventions are stable, others, less so.
Right now, the project is working to stabilize conventions for things like messaging queues, databases, and CI/CD systems. You should use these—but be warned, unstable conventions may change!
Client instrumentation and RUM
A lot of progress has been made in this area over the past year, and there’s a light at the end of the tunnel. OpenTelemetry is aligning around a way to represent things like sessions, and clicks, via its new Event type. Events are nearing the finish line, and once they’re done, we’ll see a lot of improvements to instrumentation and SDKs for client monitoring! You can try this stuff out in JS, Android, and Swift today. Once it stabilizes, I expect we’ll see more adoption into frameworks like React Native.
Profiling
Ever since the profiling data model was introduced, there’s been a ton of work to really nail the end-to-end experience of using profiling through OpenTelemetry. Work in this area was recently accelerated by the donation of a new continuous profiling agent, and hopefully by the end of the year there’ll be some solid releases to start playing around with. However, more work is needed to really stitch all this together into a cohesive whole; for instance, an integrated system Collector and profiler.
Declarative configuration
Right now, configuring OpenTelemetry can be kind of a pain! That’s why the project has been working for the past year on a new, standardized configuration format for all OpenTelemetry components. Early releases are available in Java and Golang if you want to try it out, and as it gets closer to stability, there should be opportunities to kick the tires in other languages.
- This new config format will allow you to use a simple, YAML-based file rather than a mess of environment variables to do everything from modifying export configuration, to changing sampling rules, and even transforming telemetry data at the SDK level (for instance, filtering out health checks).
Tier 3 OpenTelemetry stability
Here’s the bleeding edge of the bleeding edge: things that aren’t fully realized, or are rapidly changing. You can expect this category to move towards stability over the next year or two.
Control planes and remote management
There’s a lot of foundational work for this ‘baked into’ OpenTelemetry through things like the Operator Agent Management Protocol (OpAMP), but a lot of work needs to be done before it’s ready for primetime. This feature will enable you to view all of your deployed Collectors or SDKs, get their health, and modify their configuration without requiring a redeploy. It also unlocks new abilities around dynamic sampling or alerting—imagine being able to automatically pull more data from impacted systems during an incident, but reduce it when things are running fine!
Telemetry schemas
OpenTelemetry Semantic Conventions provide for a nice foundational level of telemetry data, but you’re gonna want more than just that. You want to add custom attributes for things that matter to you and your business. In larger organizations, though, there’s a huge coordination penalty for doing this work manually.
Telemetry schemas and tools like Weaver promise a world where defining and rolling out telemetry can be done in a more automated, machine-driven way. Rather than having to create your own way to keep track of metadata, you can simply publish schemas and definitions about your own telemetry, merge them together, and even automatically generate code to make them easier to write.
Entities
Currently, OpenTelemetry tags all of your data with one, or more, resource attributes. These are meant to help you understand the source of telemetry data. However, there have been some challenges around resources: how do you uniquely identify the source of a particular data point, and how do you understand that source changing over time?
Entities are a new way that the project is thinking about this, and can be thought of as a collection of resources that unambiguously map to a single telemetry source. This will provide a lot of flexibility and value to users, as you’ll be able to easily narrow in on scenarios like what was happening on a specific node at the same time as another thing happened by simply grouping against an entity.
Black box telemetry with eBPF
Right now, the best quality telemetry comes from ‘white box’ instrumentation where you directly integrate OpenTelemetry into your application. However, recent advancements have made it possible to get a lot of interesting data by using eBPF probes.
These probes can give you a lot of the same data you get from white box instrumentation, but at a lower overhead. New work with this technology is discovering ways to improve the ability of eBPF instrumentation to participate in existing traces and act as an out-of-band SDK for native instrumentation. If that doesn’t make sense, that’s ok—it’s a pretty complex feature! There are quite a few folks in OpenTelemetry that are very interested in it though, and I expect that we’ll continue to see improvements here for quite some time to come.
OpenTelemetry works hard for you
That’s where things stand, overall! To recap: the core OpenTelemetry experience of creating traces, metrics, or logs from applications and infrastructure is pretty solid across most languages. There’s new work happening in RUM and profiling that should be pretty stable in the foreseeable future, along with continuous improvements to semantic conventions. On the horizon, there’s a bunch of exciting new stuff coming.
In the meantime, OpenTelemetry is always working on improving the performance, reliability, and ease of use of its API, SDK, and tools.
What are you most looking forward to here? Did you learn something surprising? Let me know! We have an OTel channel in Pollinators, our Slack community. Join #discuss-opentelemetry to start a conversation.
Download the whitepaper: How OpenTelemetry and Semantic Telemetry Will Reshape Observability
Want to know more?
Talk to our team to arrange a custom demo or for help finding the right plan.