It’s no secret that CI/CD pipelines make the lives of engineering and operations easier by accelerating the feedback loop for higher quality code and apps. They build code, run tests, and safely deploy new versions of your application.
But just like any aspect of development, poor integration, invisible bottlenecks, and bugs can plague your pipelines. And debugging them? Well, it’s complicated. To see what I mean, just fire up your favorite search engine to find content on “debugging CI/CD pipelines.” Look at all the different tools, studios, and blogs full of advice—it’s soul crushing.
Spoiler alert: There’s a better way, and you won’t find it on the list.
In this post, I’ll dig into how you can accelerate CI/CD pipeline builds with observability. It’s one of the topics in chapter 14 of our O’Reilly book, and the main theme of our Authors’ Cut webinar with Frank Chen, senior staff software engineer at Slack. In our webinar, Frank shares how Slack uses observability to solve CI/CD problems and discusses his concrete examples of the core analysis loop with George and me.
Why so flaky? Common CI/CD issues and costs
CI/CD can come at a cost. For example, slow builds, sluggish integration tests, and flaky tests. And suddenly you’re offering the kind of experiences that have your developers slamming the merge button regardless of whether tests have finished and passed.
Flaky tests are those that return both passes and failures even though you haven’t changed either the code or the tests. Flaky tests are not just annoyances that slow your CI/CD pipeline. They erode confidence in testing. Identifying and fixing the root cause of a flaky test means there’s one less skilled developer building new features for who knows how long. This all comes at a cost.
Another elephant in this pipeline room is well illustrated by the XKCD webcomic. A bunch of software developers are fighting with foam swords. Their manager asks why they aren’t working. The answer is “My code’s building.” Developer time is among the most precious things that your company has. Their time is money, and CI/CD slowness leaves it on the table.
No one should have to walk away from their computer for half an hour every time they do a build. Wouldn’t it be nice if you could force-multiply those developers to go faster with a forced feedback loop? The good news is that when you instrument your pipeline, you can.
It slices! It dices! CI/CD observability at Slack
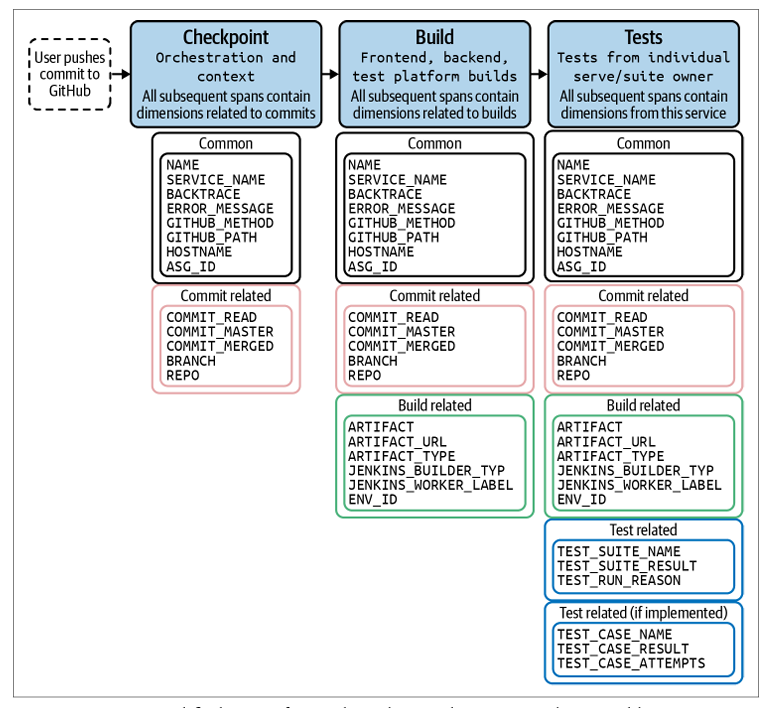
Here’s a simplified view of an end-to-end test run that highlights the common dimensions of the Slack CI workflow, courtesy of Frank, and illustrated in Chapter 14 of our book:

In essence, Slack makes common bits of telemetry and common dimensions available to teams as shared libraries. And by adding dimensions to many parts of CI, Slack can instrument first and then slice, dice, mix, and match.
How does this work? Here’s a high-level view of how Slack set up its CI to flush out root causes of flaky tests:
- Instrument the test platform with traces that capture runtime variables that haven’t been explored much previously
- Ship small feedback loops to explore interesting dimensionality
- Take dimensions that correlate with flaky test configurations and run reversible experiments on them
After gathering data and a discovery process, Slack added better defaults to its test platform and guardrails for flaky configurations. Its flake rate went from 15% to 0.5%.
Honeycombing through the data: “I had no idea!”
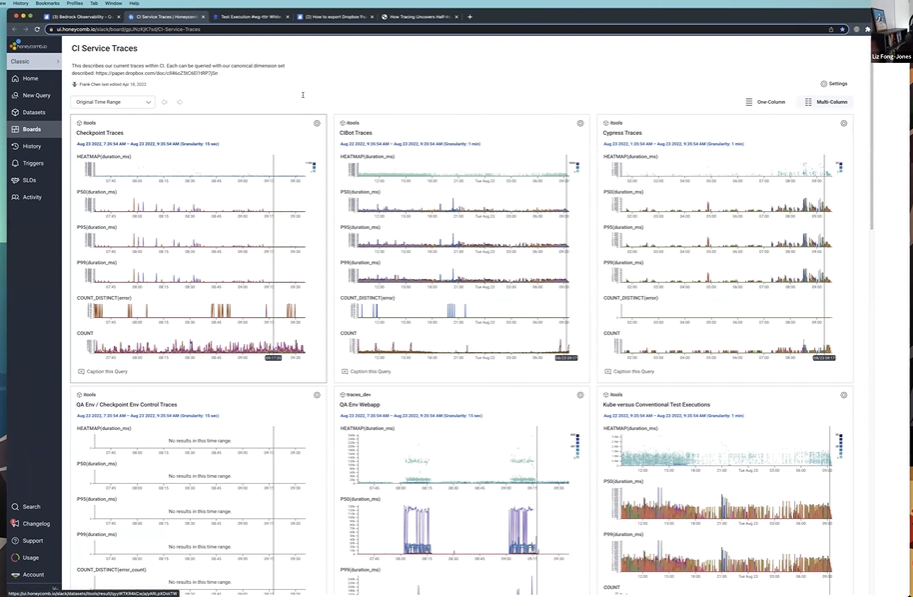
Slack uses Honeycomb for the observability that drives flake reduction and a drop from frequent to zero cascading internal incidents. It takes Honeycomb tracing data and combines it with other data to create dashboards that make discovery easier. Here’s an example from Frank:

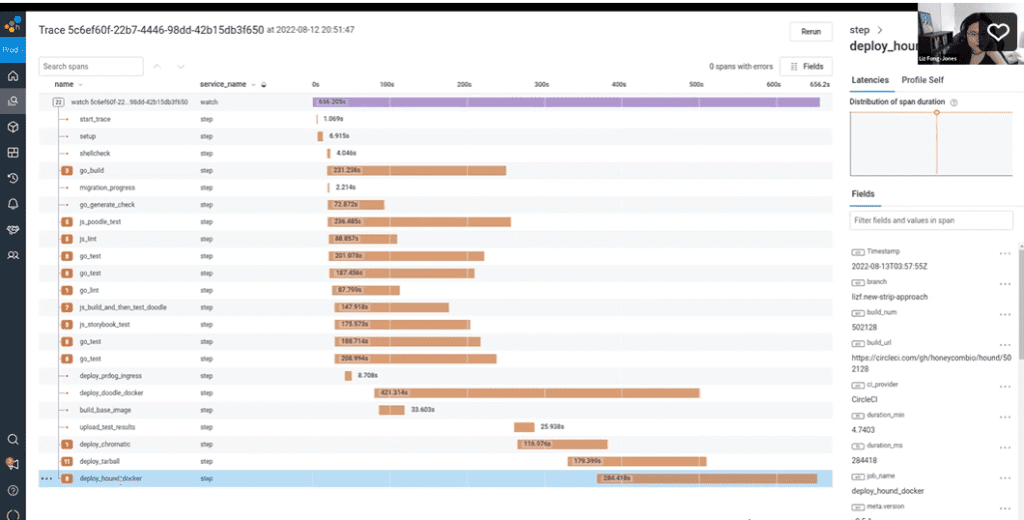
Slack also uses observability to resolve problems with latency. With Honeycomb, you can jump right into a trace of a build and see the critical path of latency, like this:

There you have it. Adding observability to your CI/CD pipelines will help you address the issues that are costing you time and money. Slack saw a 10x improvement in IT spend on CI/CD from saved re-running of flaky tests (not to mention the improvements in development productivity) after resolving their CI/CD issues with observability. The business benefits are critical, but Frank also admits that it also delights him to hear someone say either “I had no idea that was so slow” or “I thought that service was slow but look at those traces. It’s faster than we thought.”
How to chase away the pipeline blues
This is just a small slice of our honey cake of a discussion on accelerating CI/CD with observability. If you’re interested revolutionizing how you debug pipelines, check out the webinar recording or our O’Reilly book to learn all the details.
Stay tuned for our next discussion in our Authors’ Cut series on August 23, where we’ll be making the business case for observability. If you want to give Honeycomb a try, sign up to get started.


