Brick by brick, block by block—if you’ve been with us throughout our Author’s Cut blog series (and if you haven’t, you can go catch up), you’ve seen us build the case for observability from the ground up. We’ve covered structured events, the core analysis loop, and use cases for managing applications in production—and that’s just to start.
In this post, we’re moving from the foundations of observability to things that become critical when you start practicing observability at scale. Tools like sampling and telemetry pipelines are useful at any size, but when your trickle of observability data suddenly becomes a torrential flood, these tools are essential.
If you want to dig deeper, check out Chapters 17 and 18 of our O’Reilly Book: Observability Engineering Achieving Production Excellence. You can also watch our Authors’ Cut webinar to see a live demo with Slack engineering leaders Suman Karumuri and Ryan Katkov that showcases their use of telemetry pipelines at scale.
Smart sampling (or not every event is precious)
To sample or not to sample, that is the question.
In an ideal world, you’d obviously prefer to keep 100% of your telemetry data to retain full fidelity. But at scale, when you’re forced to consider every single performance tradeoff, do you really need to keep every single one of those 10 billion “200 OK” status responses, or do you just need to know that you had 10 billion of them?
Most people starting out with sampling have one question: How do I know I’m not sampling away the data I actually want? The short answer is that you typically care about errors more than you care about successes, so you sample successes more and sample errors less (or not at all). While Chapter 17 dives deep into the weeds of various sampling strategies, there are a couple we’ll summarize to illustrate that approach.
First, you can use variable sample rates. For example, you might choose to sample some of your traffic (e.g. failures) one for one and some (e.g. successes) one for 100, keeping a higher proportion of the more interesting traffic at full fidelity. For the sampled data, you can then weight the retained representative events to extrapolate the missing data if you need to, though working with the approximate shape of successful events would more than suffice in debugging scenarios.
Second, you can use intelligent tail-based sampling. At Honeycomb, we use Refinery as our sampling solution because it can look at each trace once it’s finished. Was it a slow request? Was it an erroring request? Was it an outlier event that we care more about? If so, we keep every single one. But if it’s one of the hundreds of millions of requests that was fast and successful, we might keep only one out of 1,000.
In other words, smart sampling can capture what’s interesting to you and let you drop most of what’s not. With sophisticated sampling strategies, like those in Refinery, you can get tracing and scale, efficiently and economically.
The what and why (and so what) of telemetry pipelines
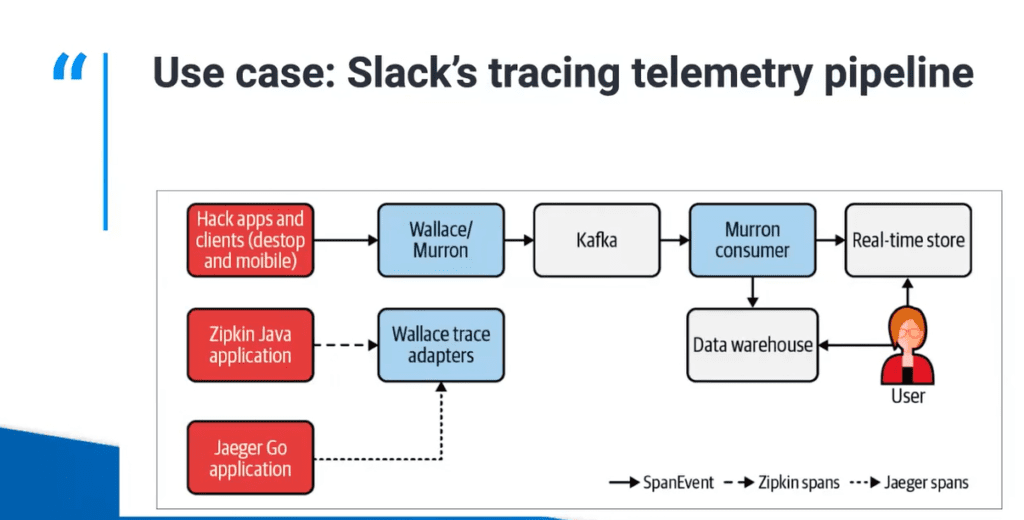
When it comes to a great example of practicing observability at scale, look no further than the lessons from the folks at Slack. Slack routes millions of events per second to multiple backend systems, and the team has developed a strong telemetry management practice that makes services sufficiently observable while minimizing the burden on developers. How? By using telemetry pipelines—software that ingests telemetry data from various applications and manipulates that data before delivering it to various telemetry backends.
Slack’s telemetry pipelines do a lot of heavy lifting beyond playing the role of telemetry traffic manager:
- They help ensure security and compliance requirements are met. Each backend includes retention, access, and location policies specific to that data.
- They’re integral for capacity management—at Slack, roughly five trillion events go through telemetry pipelines each month, and 500 billion of those go to Honeycomb.
- They’re where data filtering and augmentation happens. For example, Slack filters data for personally identifiable information (PII) and augments data with metadata to make it easy for users to consume.
Managing the pipeline that manages the telemetry
While a simple telemetry pipeline has only three components (a receiver, a buffer, and an exporter), Slack’s is a bit more complicated. We won’t get into the details here, but you should check out the webinar if you want to learn more about how Slack’s telemetry pipeline works.

What we will get into are some of the challenges of maintaining telemetry pipelines:
- Performance: Managing telemetry pipelines comes at a cost, and the Slack team is constantly tuning each pipeline’s performance in terms of resources consumed. The goal is to keep the amount of processing in the pipeline to a minimum.
- Availability: A telemetry pipeline is a real-time system, and users expect to see their data in real time. Like any mission-critical application, maintenance has to be planned to keep the system up and running.
- Correctness: At Slack, users can add rules for data filtering and transformation within the pipeline. The team must be sure the pipeline isn’t dropping or corrupting the data in some unintended way.
- Data freshness: The team also needs to confirm the pipeline isn’t lagging. If it is, they need to make a decision: either backfill the data, scale the cluster to catch up, or temporarily drop data.
With such critical operations on the line, it’s not surprising that Slack uses the same observability tools to manage its telemetry pipelines as it does to manage the applications that feed into those same telemetry pipelines. How meta!
Some advice from Slack
The final word on this subject (at least for this blog post) comes from Suman Karumuri, Engineer, Observability at Slack. “Once you hit a certain scale in observability, having a strong telemetry pipeline is what gives you a real-time view into your business.” We couldn’t agree more!
We hope you’ve enjoyed the Authors Cut series. This is our last post as we cover chapters from the O’Reilly book. But don’t worry, Honeycomb has more great content in the works—and if you missed any of our prior chats, you can find them here. If you want to give Honeycomb a try, sign up to get started.


