When Charity and I started pitching Honeycomb, we had a “bit” we would do, on the importance of building for teams: I’d identify her as the {Kafka, Mongo, insert tech-of-the-moment here} expert on the team, identify myself as the newcomer, and pantomime awkwardly leaning over her shoulder to see how she debugged some unexpected behavior. Because that’s how humans learn—you ask a teammate, you watch how they do things, and you slowly develop your own “expert intuition” of how the software behaves.
Ever since the beginning, Honeycomb has been built for teams, recognizing that the best way to level up your non-experts (or support a distributed team, or simply allow experts to go on vacation) is to weave collaboration and knowledge sharing functionality into the fabric of the product. What we’ve recently identified as an emphasis on “sociotechnical” systems, we’ve been upholding as part of our manifesto since Year 1.
The reality is, no one knows how to debug every single part of a system. So capturing and sharing that knowledge—which signals to look for, which fields are interesting in what context becomes key—whether across teams; between teammates; or simply between your past, present, and future self.
Active knowledge transfer is commonplace (if dependent on goodwill on the part of the experts): you see it in a culture of documentation, consistent retrospectives, retrospective write-ups, or thorough incident playbooks.
Passive knowledge transfer is less common, and—we think—woefully underrated. What if experts could leave breadcrumbs for their teammates, in the form of links in Slack or their browsing history? What if non-experts could replay history and learn from the “paper trail” left by experts as they explore a tool?
We’ve thought a lot about this. Here’s how we’ve built Honeycomb to support teams in production, and not individual experts:
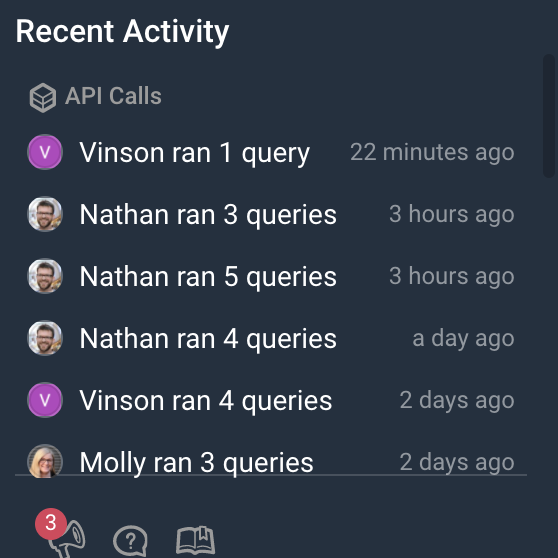
Picking up on social cues in our Query + Team Activity Feed
Working with a new system often begins with a period of orientation: understanding what data is available, which fields are significant, and what sorts of queries to start with. Some tools try to help with this by touting hints produced by “artificial intelligence”; we think that the best signals on that front come from your team.
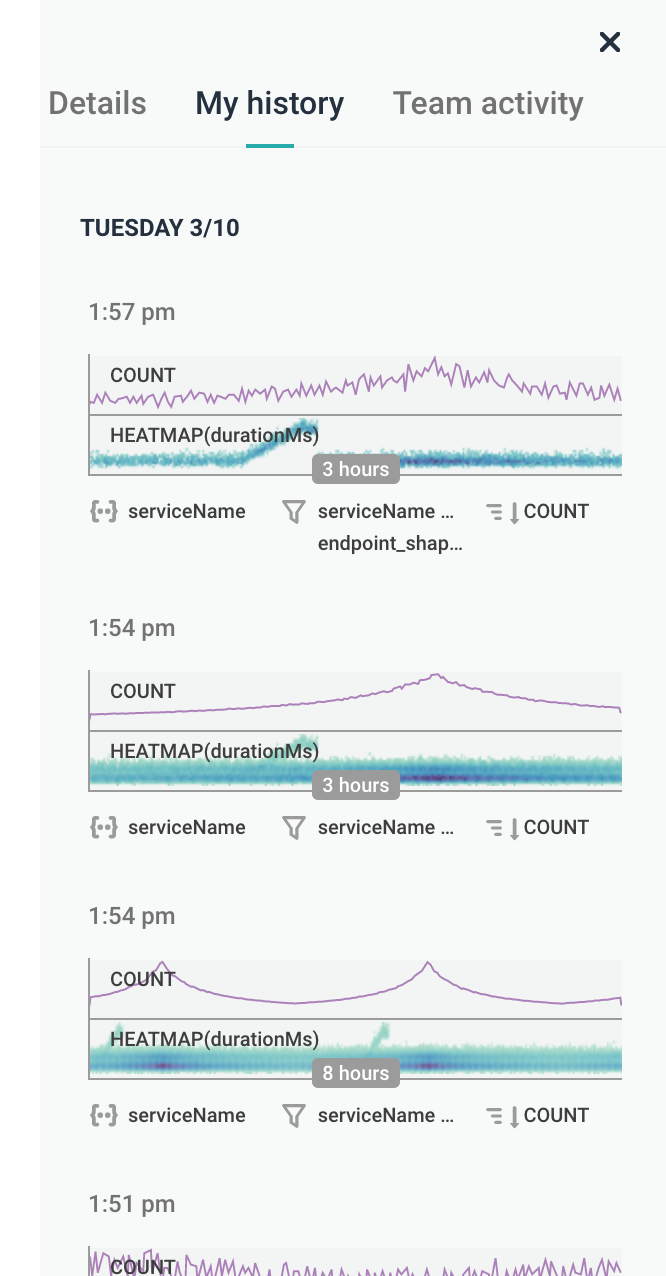
Whether you’re on Honeycomb’s in-app homepage or viewing an individual graph, you never lose the sense of activity. Every query ever run—and thus, every graph ever generated by Honeycomb—is captured in Honeycomb, then made available for browsing.
This makes it simple to see at a glance what teammates (or your past self!) found interesting, at any point in time.
Permalinks are permanent, and other truths
Our permalinks are just that: permanent links to Honeycomb graphs, representing the answer to a question, at that point in time. Nothing is worse than showing up to a post-mortem and realizing that a key graph is no longer available because the underlying data has aged out, or having to squint at screenshots.
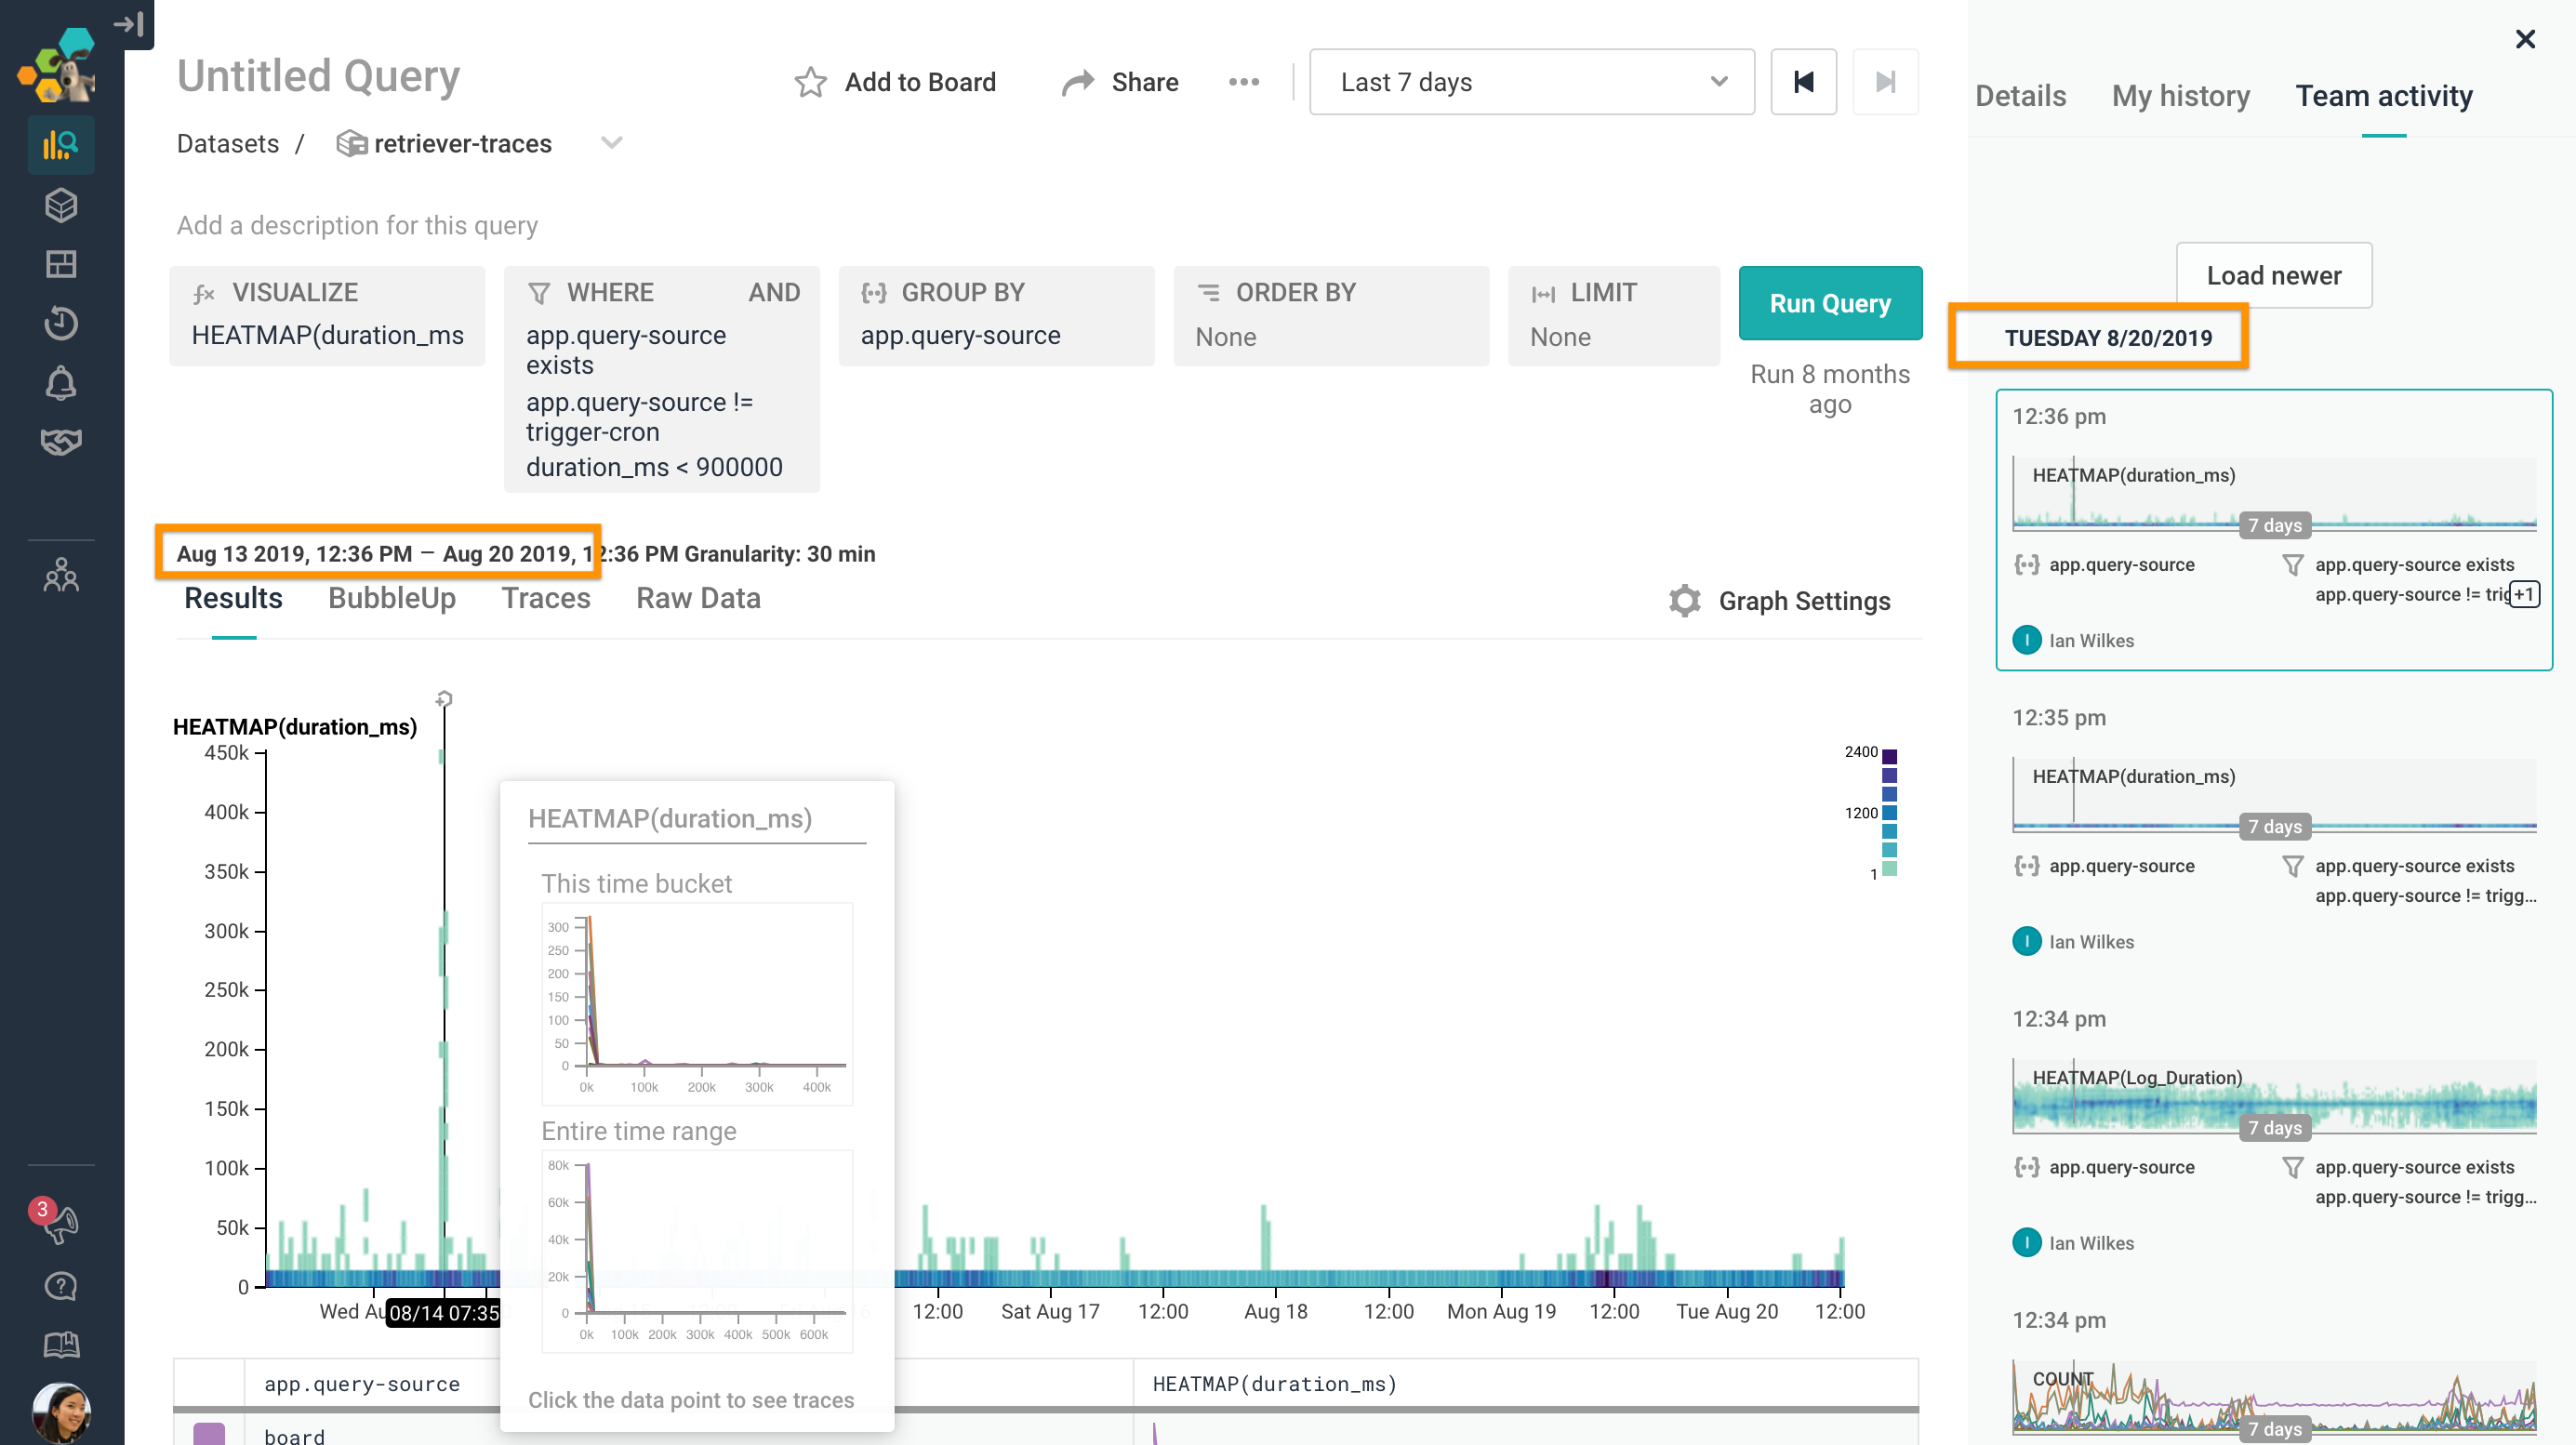
Don’t believe me? Here’s a graph from our public datasets, from mid-2018. The underlying data has aged out (or would have, if they were live datasets), but the data is still as readable (and interactive!) as if it had been retrieved today.
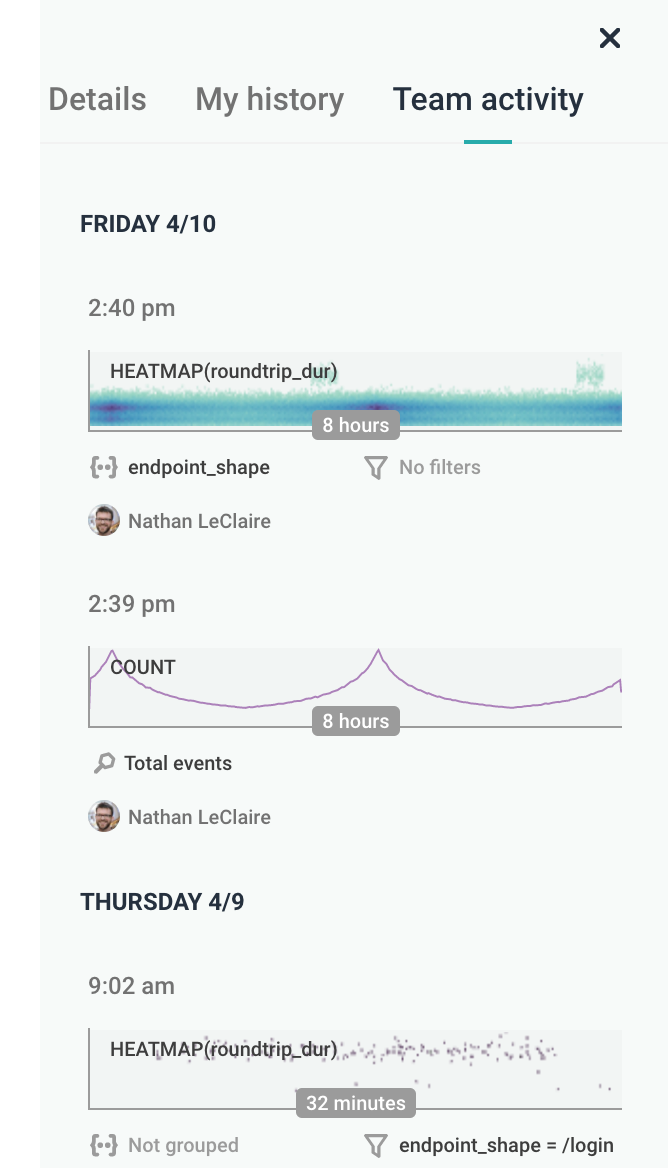
Here’s a screenshot from a more interesting permalink I found, of a dogfood dataset. I can still mouse over the heatmap, 8 months later, and to top it off, the “Team activity” feed on the right even lets me jump back to the queries run immediately before the graph in question.
Sharing Honeycomb where your team hangs out: in Slack
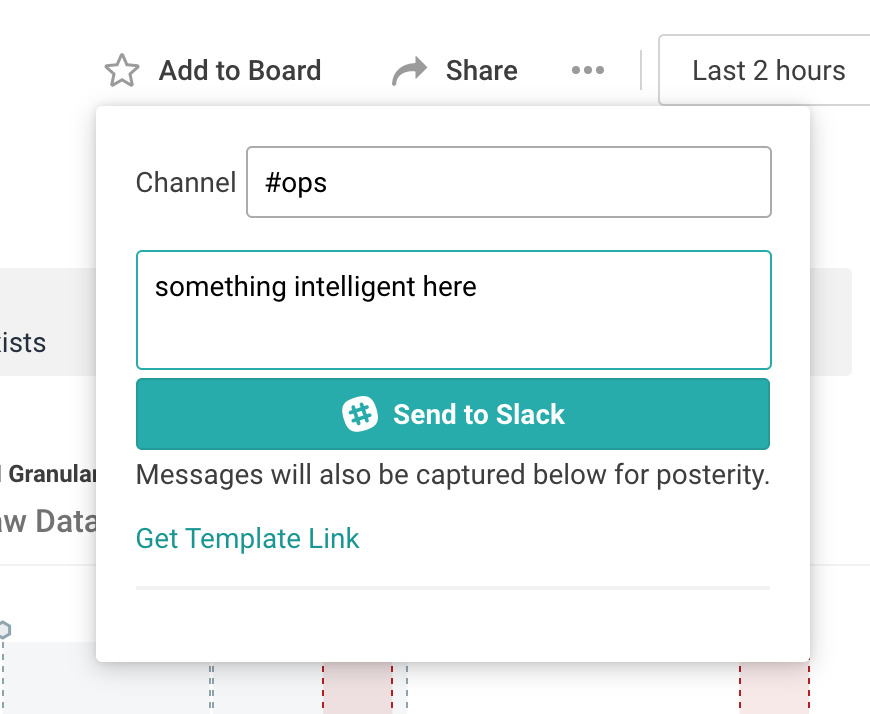
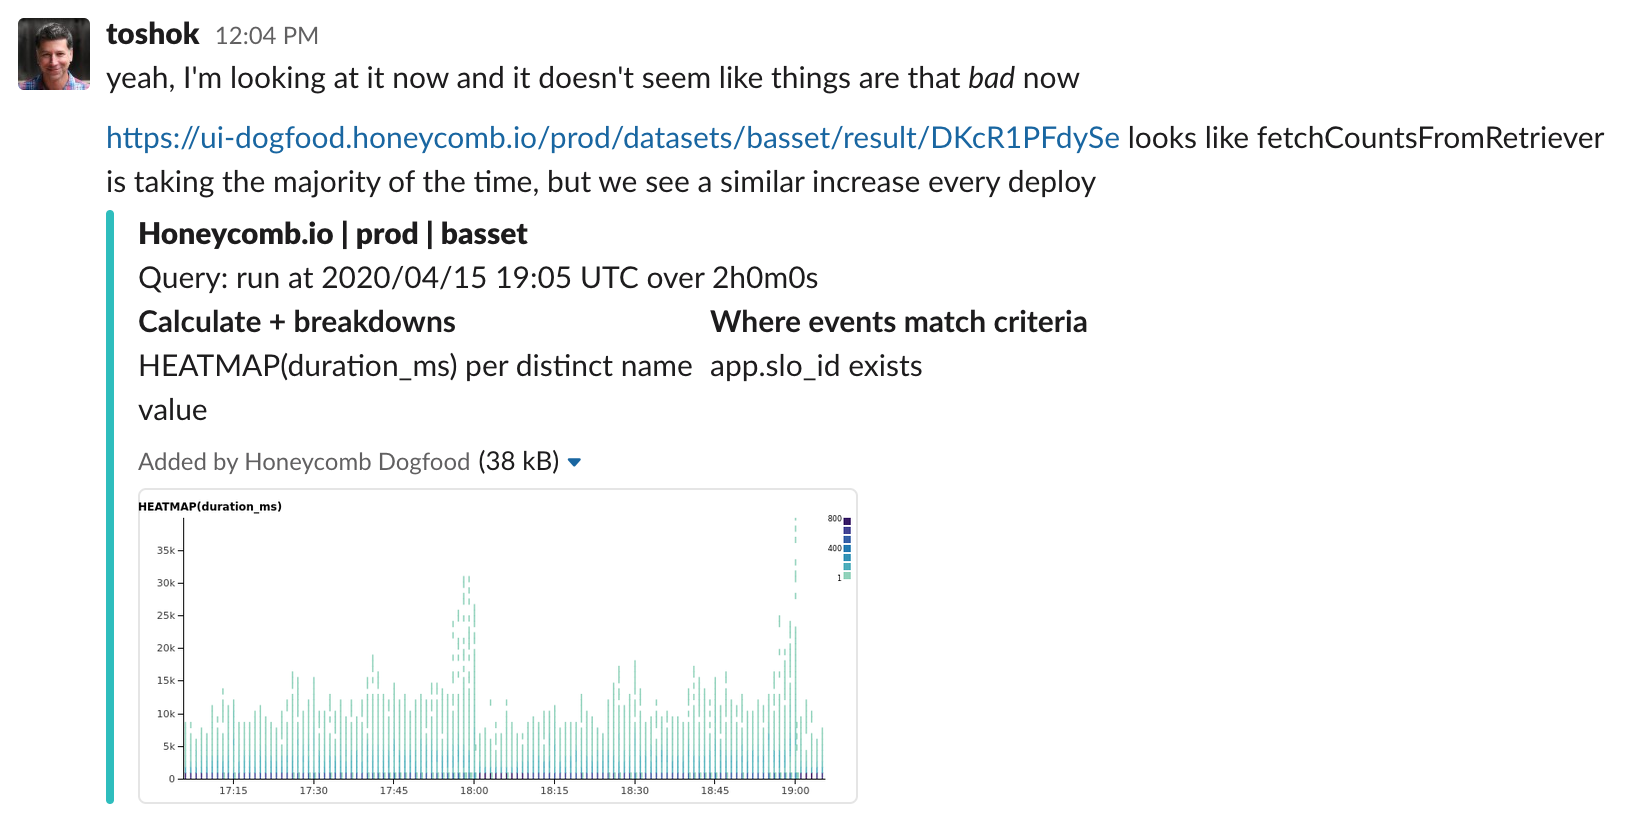
We’d rather work with your team’s collaboration tools of choice rather than try to control where folks naturally converse. Whether you use our interface to share out to Slack, or simply rely on permalink unfurls, Honeycomb’s Slack integration makes it easy for any of your teammates to click through and continue the exploration.
Mining that Query History, via Query History Search
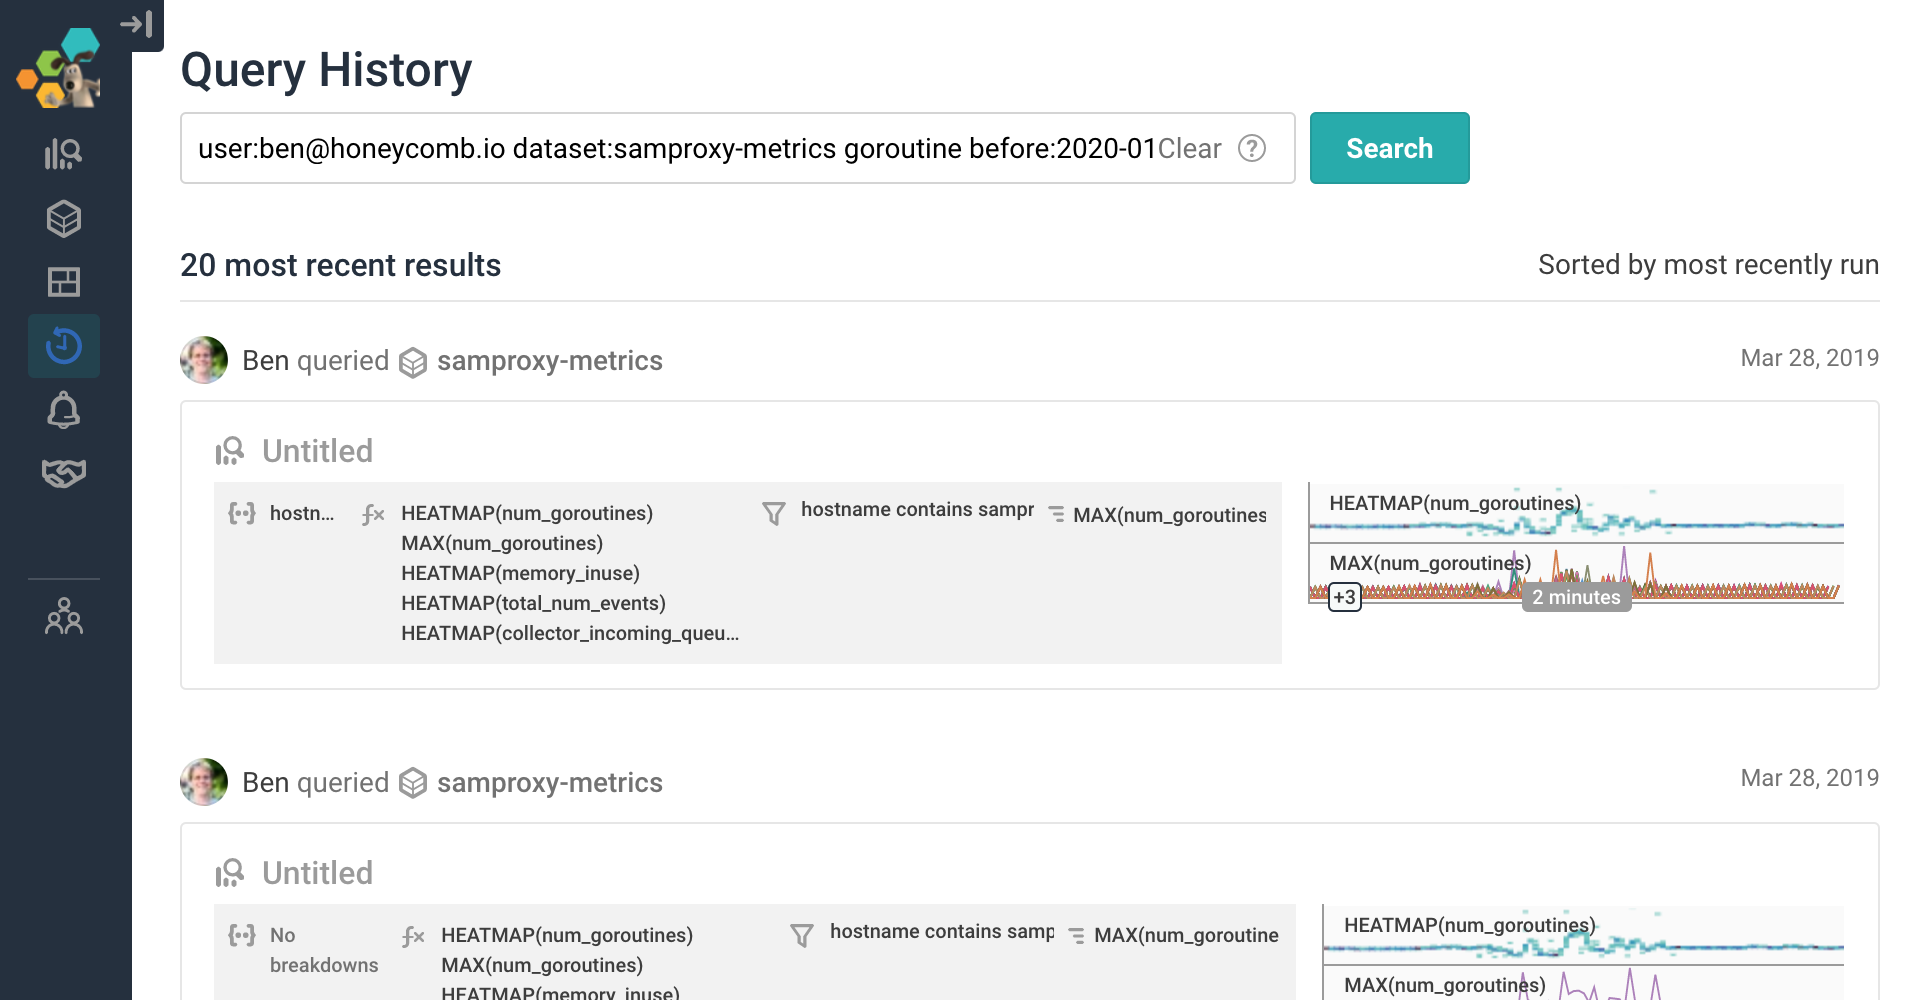
Though the feed is great for browsing for recent and “right-now” activity, it’s a little trickier to navigate to find “that one query that Ben showed over Zoom the other day when he was investigating a goroutine issue.”
But we started Honeycomb with this vision of being able to virtually peek over the shoulder of experts—and wanted to allow users to mine the rich histories their teams were building up over time.
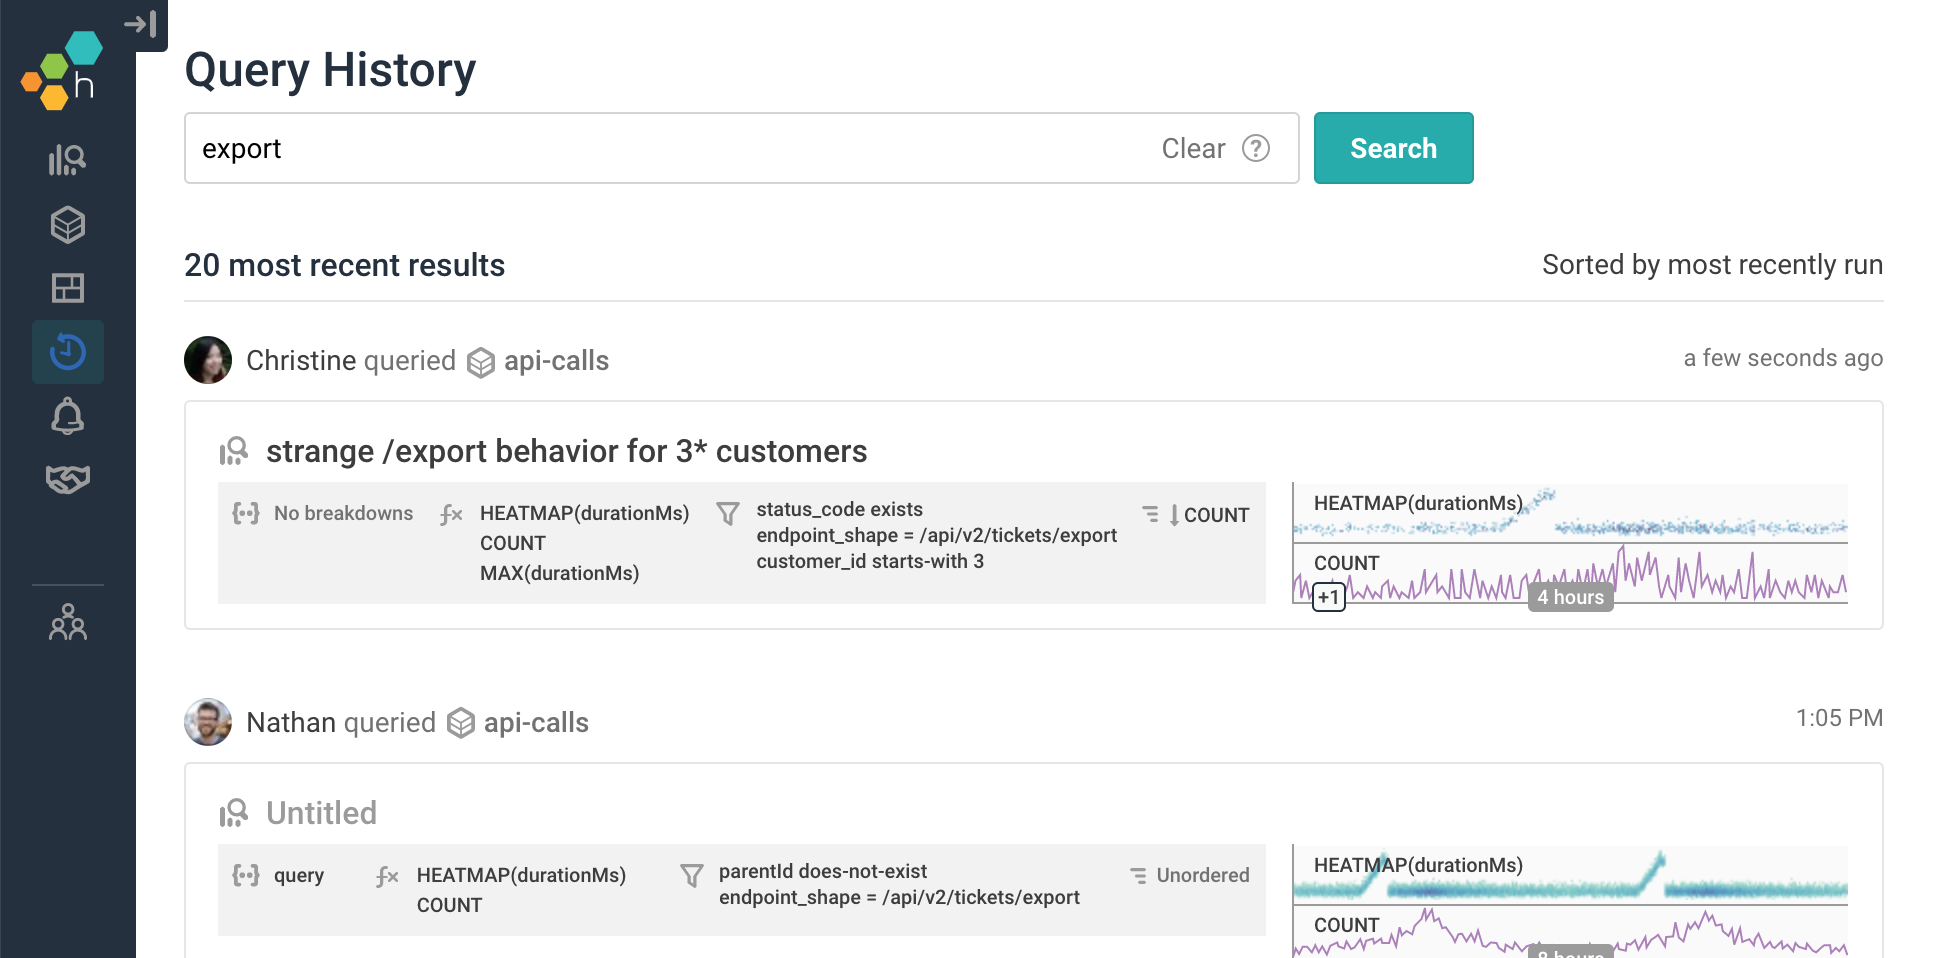
Enter Query History Search, where it’s as simple to search for a keyword across named graphs and query parameters…
… as it is to find a very specific query result, from a very specific point in time:
Bringing it all together with Service Level Objectives (SLOs)
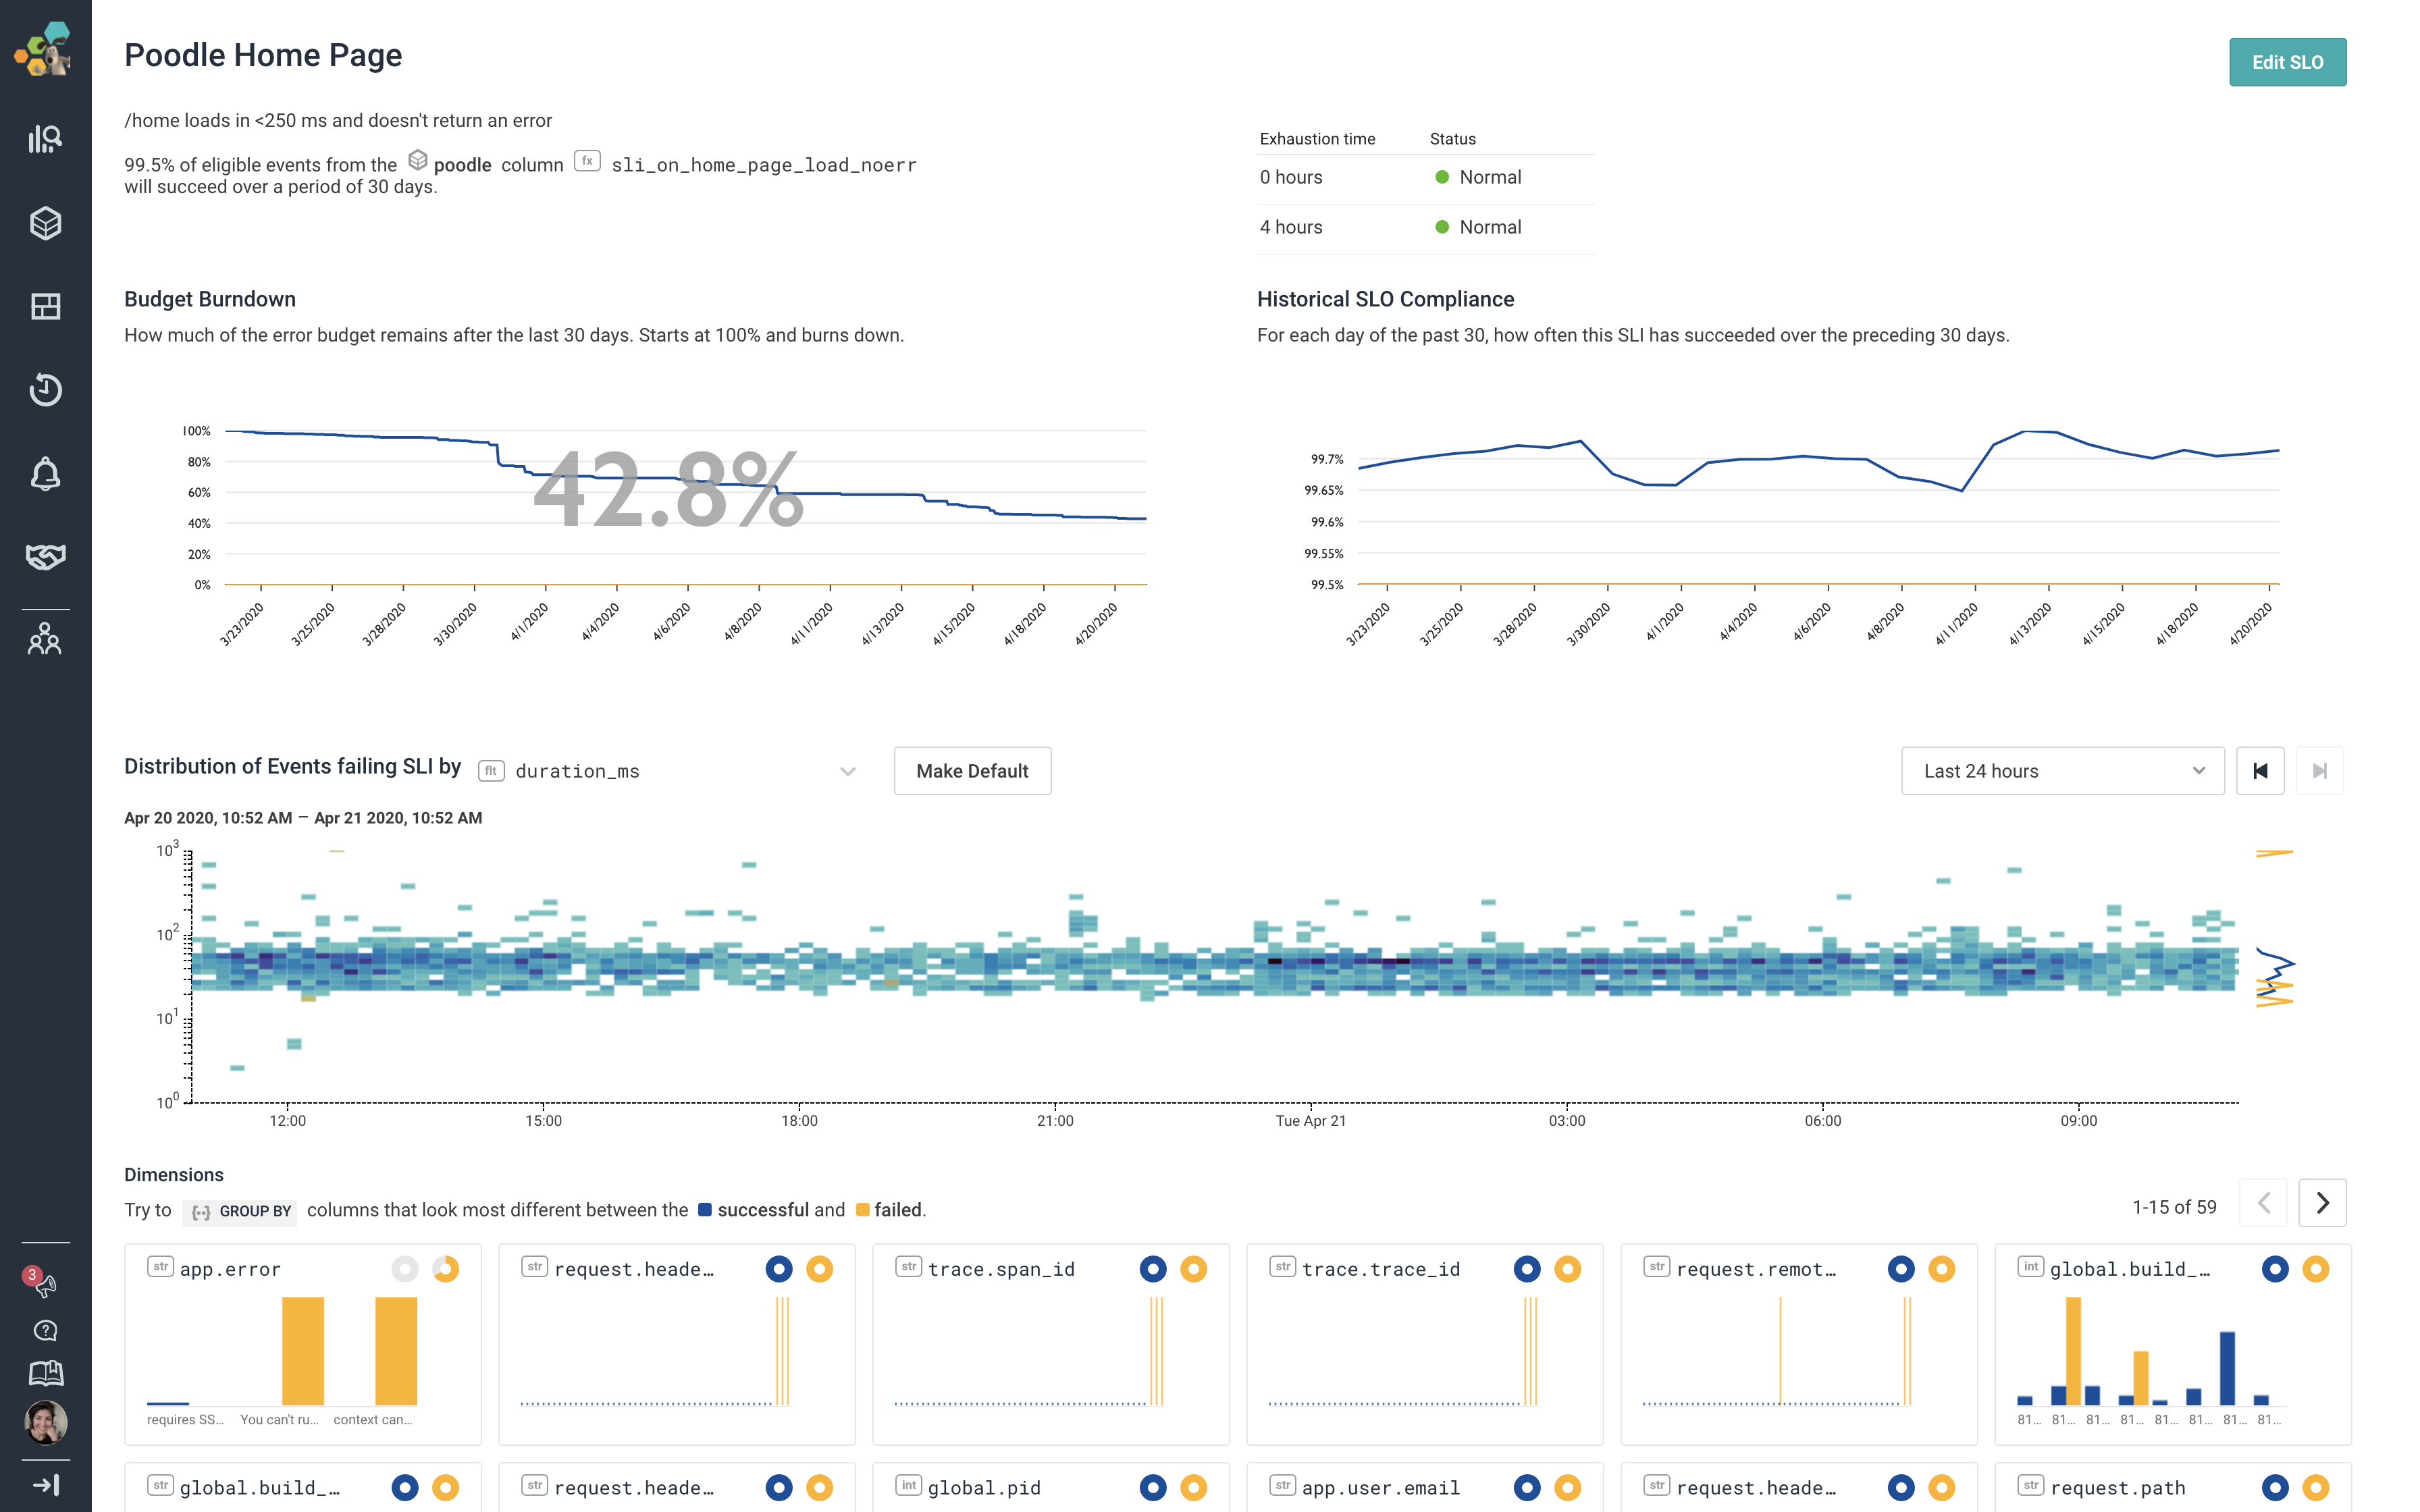
And finally, when it comes to unifying teams around fewer signals, Honeycomb’s Service Level Objectives can be thought of as the “API into your engineering team”—streamlining conversations with other teams.
Identifying the user-facing indicators that matter most to the business allows teams to focus on fewer signals and ensure folks are on the same page. Error budget burndown charts allow teams to respond proactively to service degradation long before it excessively impacts users, avoiding middle-of-the-night pages and buying more time to discuss solutions.
Whether you’re alone while on call late at night, or just physically alone during state-mandated “shelter in place,” we built Honeycomb to feel like you’re never really alone.
Want more?
- Episode 1 of our Raw and Real webinar series runs through a quick demo of some of these features
- Our Culture of Observability guide explores the human side of—and enabled by—observability
- Visit honeycomb.io/signup and start sending your data today!


