Tracing Refinery
We recently released Refinery 2.9, which came with great performance improvements. Reading through the release notes, I felt the need to write a piece on this improvement, as it’s quite important but easy to overlook: collect loop taking too long. This is the story of how we used distributed tracing to find the slowdown in this loop.

By: Tyler Helmuth


Options for Managing Telemetry Volume At Scale & How Slack Does It
Learn MoreWe recently released Refinery 2.9, which came with great performance improvements. Reading through the release notes, I felt the need to write a piece on this improvement, as it’s quite important but easy to overlook: collect loop taking too long. This is the story of how we used distributed tracing to find the slowdown in this loop.
What was the problem with the collect loop?
We were alerted to this performance issue by a customer. Their Refinery instances were handling a lot of traffic—more than our own Refineries—and they noticed their Refinery pods getting killed by Kubernetes as they were failing liveness checks (Refinery expects two of its internal loops, stress relief and collect, to report back within a fixed time limit—else, they report as unhealthy).
We knew from Refinery’s logs that the collect loop was taking too long. To solve the problem temporarily, we released Refinery 2.8.3 and 2.8.4, which respectively allowed users to configure this health check’s timeout and added a new metric to record how long the collect loop took.
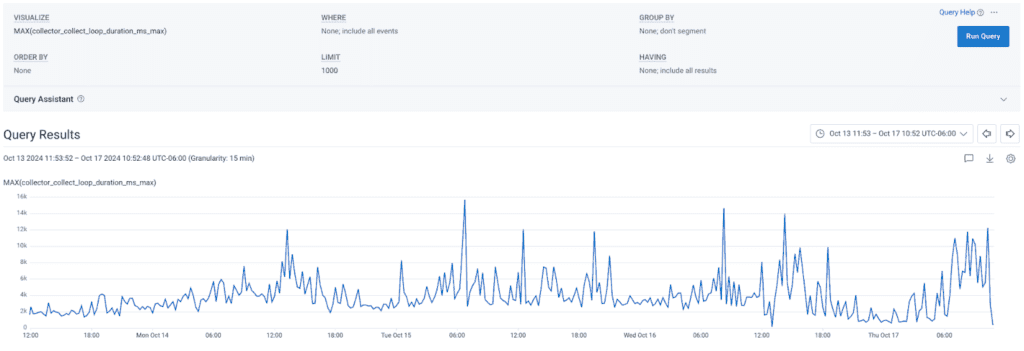
This solved the health check issue, but we were still surprised by the results of the new metric: it showed this customer’s collect loop sometimes took over 20 seconds for a single cycle! With the new metric, we noticed the same problem in our own cluster:

But why?!
We needed to know why this loop sometimes took so long—and a metric wasn’t going to be enough, as it couldn’t give us the details of what was actually happening inside the loop. We decided to instrument the collect loop with distributed tracing.
The collect loop is Refinery’s primary work loop. During each pass, Refinery may take one of several actions:
- Pull a span out of the incoming queue and process it
- Make sampling decisions and export spans
- Reload configs
We needed to know which action(s) caused the slowdown.
We used OpenTelemetry to instrument the loop. With tracing, we could see the duration of the entire loop, but also the duration of any action the loop took. Additionally, we could easily record metadata about the cycle, such as the number of traces being expired, the number of spans being exported, or the reason for a sampling decision.
We were concerned about the amount of data this would produce, since we’d get a trace with many spans every time it went through the neverending for loop, so we used head sampling to reduce the amount of data we emitted. Unfortunately, this resulted in unhelpful data. The loop didn’t always take a long time, and when head sampling, those traces would sometimes get discarded. We needed tail sampling—we needed Refinery. However, using the Refinery instance to tail sample its own traces surfaced an issue: if it was taking a long time and we sent it even more data, it could fall over. So we spun up a second temporary Refinery cluster to sample our main Refinery cluster’s traces.
With this setup, we were able to guarantee that any trace longer than one second was kept.
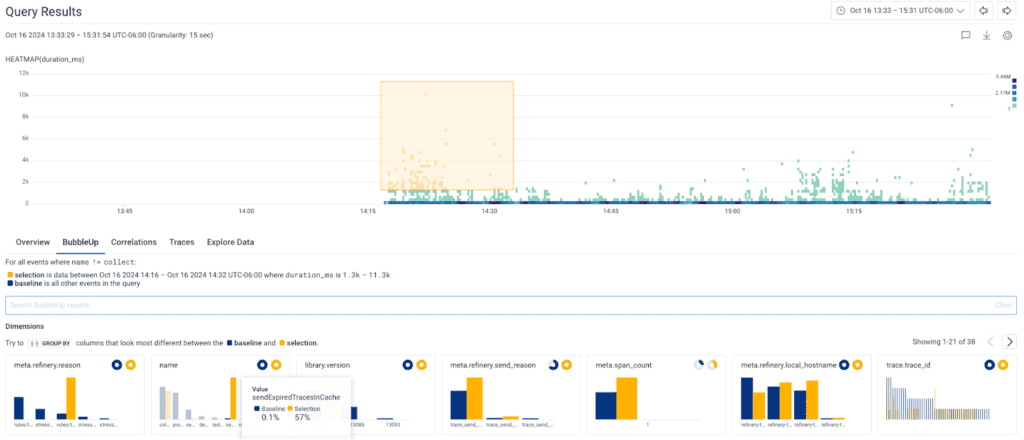
Once the traces were tail sampled, it took a single query and BubbleUp to see what was taking a long time: sendExpiredTracesInCache.

Welp, there’s our culprit. But still, why?!
Thanks to the attributes we recorded, we could see a correlation between long collect loops and the number of traces that we were processing in sendExpiredTracesInCache. This function handles sampling decisions (i.e.: dropping or exporting traces). The more traces we processed, the more work needed to be done, and the longer it took.
At this point, we knew the culprit—but we still didn’t know why sendExpiredTracesInCache sometimes took a long time.
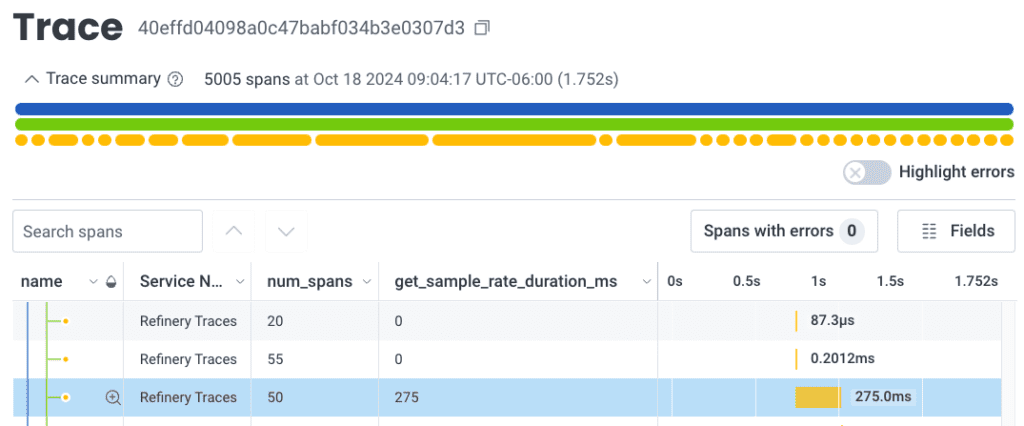
The traces showed us that sometimes, the decision for a trace would take 40ms—and other times, it would take 275ms. We knew something was going on in the decision-making process, but we weren’t sure what.

To find the problem, we leveraged distributed tracing once more.
We added more instrumentation deeper in the collect loop, this time trying to record which sampler was used to make sampling decisions when these decisions took a long time. With that attribute in place, we found our suspect: EMADynamicSampler.
Now that we knew which sampler to investigate, we went searching through its code and found locks.
It uses these locks when recalculating the sample weight, but also when being asked for a sampling decision. It turns out the sampling decisions were sometimes being blocked while the sampler recalculated its weights.
To resolve this issue, we opted to allow users to configure a maximum on how many expired traces could be processed during a single loop pass. We again used tracing to confirm this solution worked. As we set different values, we could correlate trace durations and the number of expired traces. The result was a new, proper default value of 5000—which, according to our tests, capped the collect loop at a max of three seconds.
Tracing saves the day
Without tracing, it would have taken much longer to find these results. With a good tail sampler like Refinery, we were able to ingest every interesting trace while sampling the uninteresting ones, saving ourselves money and resources. This improvement (and more!) are now available in Refinery 2.9.
Speak to our experts to try Refinery today!
Want to know more?
Talk to our team to arrange a custom demo or for help finding the right plan.