Troubleshooting CORS Errors in Offsite API Calls
In this article, I’ll clear up the confusion around Cross-Origin Resource Sharing (CORS), specifically discussing preflight requests, which are the bane of engineers everywhere.

By: Ken Rimple


It’s 2025, The Frontend Deserves Observability Too
Learn MoreYou may have wrestled with a web application attempting to call an offsite web service, such as an OpenTelemetry Collector, and gotten an odd error with the word CORS in it. Something like:
Access to fetch at 'http://localhost:4138' from origin 'http://localhost:5173' has been blocked by CORS policy: No 'Access-Control-Allow-Origin' header is present on the requested resourceOr, maybe you got a generic thrown error from your fetch statement that states Error: Failed to fetch …and you wondered, “What’s the problem, and how can I fix it?”
These kinds of errors are called CORS errors, and they can be a bit confusing. You encounter them when configuring separate domains for your web and API endpoints, or when configuring your frontend to send telemetry to Honeycomb or an OpenTelemetry Collector.
In this article, I’ll clear up the confusion around CORS, specifically discussing preflight requests, which are the bane of engineers everywhere.
What is CORS?
Cross-Origin Resource Sharing (CORS) was created to prevent applications from accessing third party sites, including other subdomains (cross-origin requests), in JavaScript fetch, XMLHttpRequest calls, and a few others without proper approval.
CORS is automatically activated for any potentially destructive calls to the target URL, such as PUT, POST, DELETE. For more information on scenarios that force a check, read this section of the Mozilla Developer Network CORS reference.
Please note: CORS is not a security mechanism; it prevents malicious websites running in well-behaved browsers from spamming a resource server with API calls.
How does CORS work?
When a browser makes a potentially destructive network call (PUT, POST, DELETE) to another host/port, CORS intercepts the original cross-origin server request, and issues a special preflight check to the target URL, with HTTP method OPTIONS. This request uses several headers to ask the question, “Do you want this API call from here?”
Again, the key thing to remember is: an operation is checked with CORS (with some exceptions) when called in the browser for a resource (url) in a domain other than the one the website was loaded from.
What does a successful CORS communication look like?
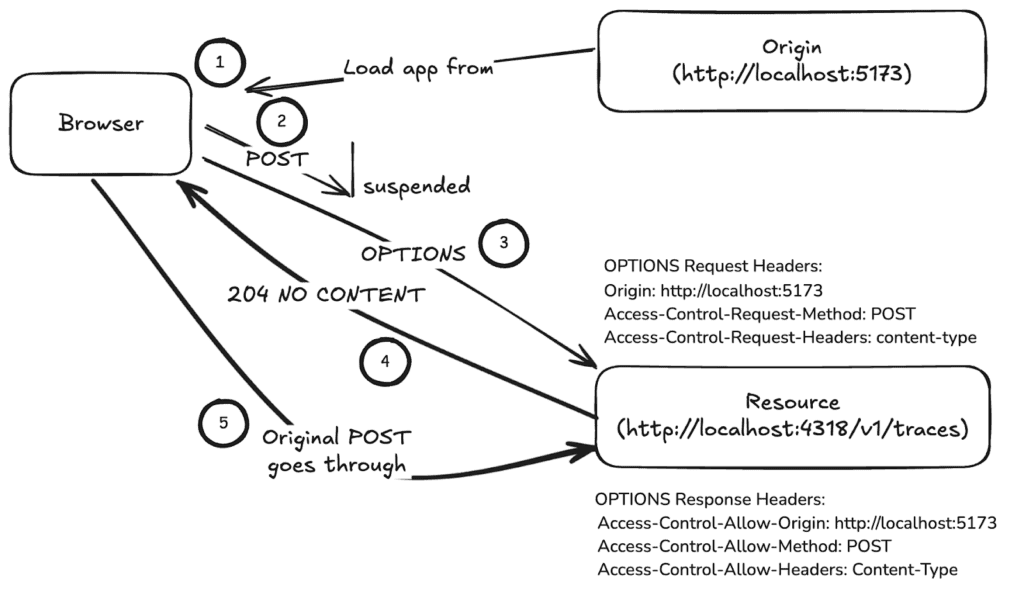
Here’s what it’s supposed to do:
- CORS suspends your post to the offsite URL.
- A preflight request is triggered.
- The same URL is called with OPTIONS instead, and a few automatically set headers (as shown for step 3 in the diagram below).

Detailed steps:
- When the page is loaded (see #1 in the diagram), the browser accesses the origin, which loads the HTML and associated JavaScript application code, booting the application.
- Later (#2), the application issues a fetch call to POST at a resource server, with a different host name. It intends to send content using the application/json content type. The browser sees that this is a potentially destructive or mutating method, and suspends the POST call.
- The browser then issues a CORS OPTIONS request (#3), with these three header-value pairs:
- Origin, set to http://localhost:5173 (the web site’s origin)
- Access-Control-Request-Method, set to POST
- Access-Control-Request-Headers, set to content-type
- The resource server compares these requested values against the CORS configuration it has. In this case, the server allows the call to go through, so the response (#4) is a 204 NO CONTENT status, with the response headers of Access-Control-Allow-Origin, Access-Control-Allow-Method, and Access-Control-Allow-Headers.
- The original POST is now greenlit and called with its original values (#5), and the response is returned to the application as if it wasn’t suspended at all.
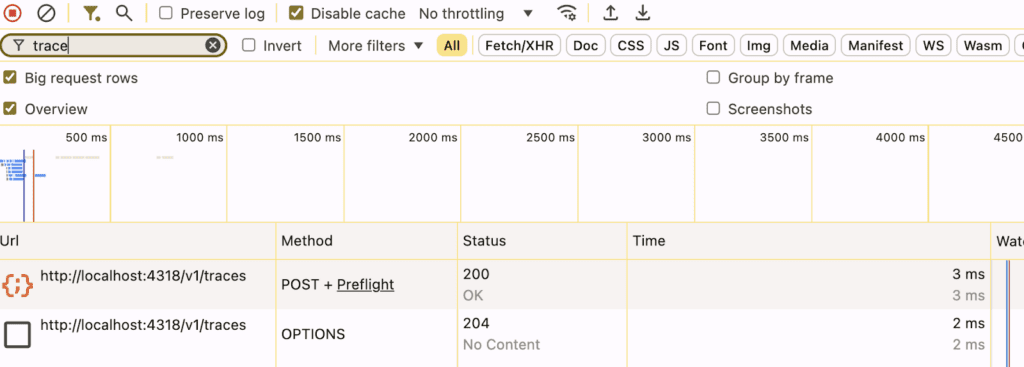
Here’s an example of a successful request in the Firefox Developer Tools Network tab. Notice how the OPTIONS call is below the POST call. This is because POST is suspended, and the OPTIONS call is triggered after suspending it.

Here is the same view from Chrome’s Developer Tools Network tab. If you don’t see the OPTIONS call, perhaps it is showing only the fetch/XHR operations. In that case, make sure to click ‘all’ so you can see both the OPTIONS and the POST.

When things go wrong with CORS requests
There are several failure modes for CORS. Understanding them helps you troubleshoot your specific problems.
When the server is offline
This is the easy one: you might not have connectivity to the server. The ERR_CONNECTION_REFUSED response will come from the preflight OPTIONS request, and this will cancel the POST, which logs the same error. Make sure you can curl to the server and port.
When CORS is not configured for the endpoint
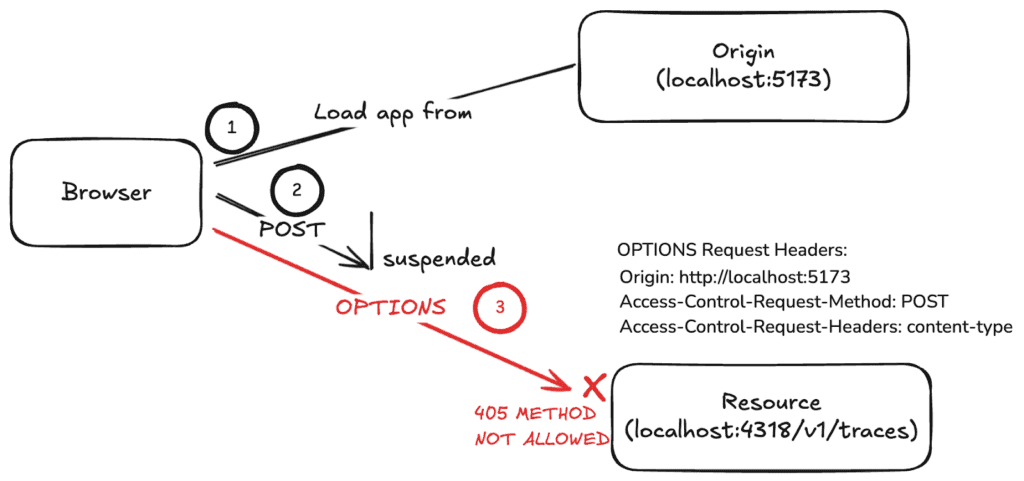
If the server has not enabled CORS for the endpoint, the OPTIONS call will not be understood. This results in a 405 METHOD NOT ALLOWED response, which fails the CORS check. The error in the browser console looks like this:
Access to fetch at 'http://localhost://4318/v1/traces' from origin 'http://localhost:5173' has been blocked by CORS policy: No 'Access-Control-Allow-Origin' header is present on the requested resource. If an opaque response serves your needs, set the request's mode to 'no-cors' to fetch the resource with CORS disabled.

POST http://localhost:4318/v1/traces net::ERR_FAILED 200 (OK)The diagram for this interaction:

No successful OPTIONS call, no CORS.
Firefox shows this in the network tab (note that you have to inspect the OPTIONS call to find that it received the 405 METHOD NOT ALLOWED response):

Chrome shows it slightly differently, identifying the error as a 405 return code from the OPTIONS call:

To fix this error, make sure you configure CORS on the server properly.
Configuring CORS for an OpenTelemetry Collector
For an OpenTelemetry Collector, you can enable CORS properly with the cors option on the receiver you’re configuring. Make sure to set the allowed_origins to include your website origin:
receivers:
 otlp:
   protocols:
     http:
       endpoint: 0.0.0.0:4318
       cors:
         allowed_origins:
- "http://localhost:5173"You may include multiple website origins, and you can also use wildcards like http://*.
Note: OpenTelemetry is designed to fail without throwing errors upward to your application. Instead, the errors appear only in your console log. If you’re not getting frontend telemetry, check those console logs and your networking tab (search for trace to limit the output).
RUM can leave questions unanswered.
Honeycomb for Frontend Observability doesn’t.
OPTIONS succeeds but says ‘no’
When a properly configured CORS-enabled endpoint fails the preflight check, it’s because the requested API call is unauthorized. For example, the allowed origin might be wrong, or the method allowed might be PUT instead of POST. Or maybe you requested to pass a header, like X-Honeycomb-Team, which your CORS configuration didn’t expect.
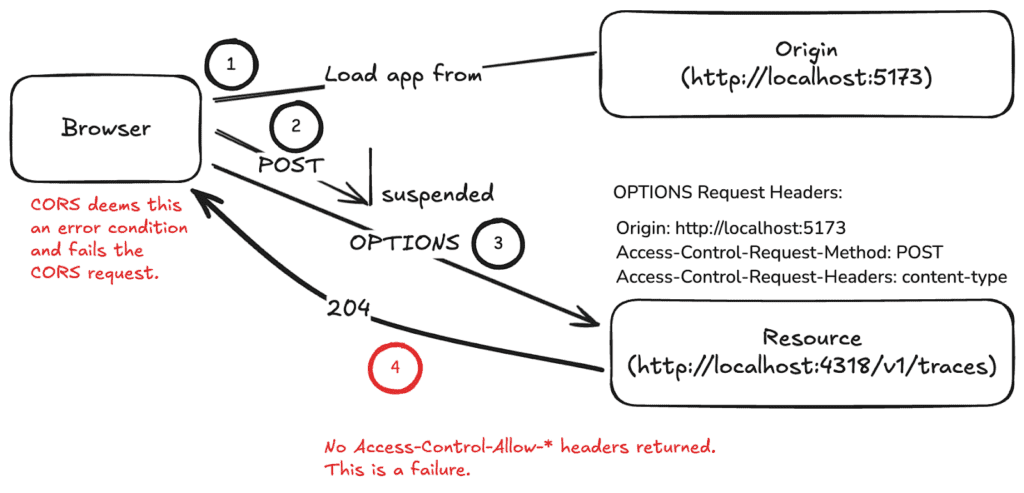
In this case, the OPTIONS call returns with a 204 NO CONTENT response, but it does not include the magical headers of permission: Access-Control-Allow-Origin, Access-Control-Allow-Headers, and Access-Control-Allow-Method. This fails the check, canceling the POST.
A console log error from Firefox shows the CORS check failure:
Cross-Origin Request Blocked: The Same Origin Policy disallows reading the remote resource at http://localhost:4318/v1/traces. (Reason: CORS header ‘Access-Control-Allow-Origin’ missing). Status code: 204.

Cross-Origin Request Blocked: The Same Origin Policy disallows reading the remote resource at http://localhost:4318/v1/traces. (Reason: CORS request did not succeed). Status code: (null).Or, in Chrome:
Access to XMLHttpRequest at 'http://localhost:4318/v1/traces' from origin 'http://localhost:8080' has been blocked by CORS policy: Response to preflight request doesn't pass access control check: No 'Access-Control-Allow-Origin' header is present on the requested resource.

POST http://localhost:4318/v1/traces net::ERR_FAILEDThe server politely returned success, but did not let you do what you wanted—like it’s saying, “Bless your heart.”
Here is another diagram showing you what happened now:

CORS is designed not to give away too many details to the JavaScript code when it fails.These errors above are sent out to the console, not the Error in JavaScript itself.
The JavaScript code will get a generic CORS failure error. Here is an example in an application using TypeScript with React:
Messenger.tsx:53 TypeError: Failed to fetch
    at new Promise (<anonymous>)
    at Messenger.tsx:21:13
    at new Promise (<anonymous>)
    at callFetch (Messenger.tsx:20:16)
at Messenger.tsx:43:9So in this case, you should see both the POST and the OPTIONS call in the network tab, with the OPTIONS call returning a 204 NO CONTENT and the POST listed as a CORS error:
Here is the error in Firefox:

The same error viewed in Chrome:

Each browser reports the error as a CORS error, but displays it slightly differently.
When I got this problem, it was because I was sending the X-Honeycomb-Team header, which was not accepted by default in the OpenTelemetry Collector. I added allowed_headers to my configuration.
receivers:
 otlp:
   protocols:
     http:
       endpoint: 0.0.0.0:4318
       cors:
         allowed_origins:
           - "http://localhost:5173"
         allowed_headers:
- "*"Conclusion
Authorizing a second server to handle your API calls can be a complex endeavor. CORS has a number of ways to fail, and you have to fix them in server configuration. Now that we’ve seen the major failure modes, hopefully you have more information to work with as you attempt to troubleshoot your problems.
If you’re having trouble connecting to Honeycomb for Frontend Observability, you can always reach out to me for assistance on our Honeycomb Developer Advocate Office Hours page. I’m Ken Rimple, and I focus on frontend and web observability issues.
Resources
- A good overview on CORS (from Mozilla Developer Network)
- Send Browser Data with Honeycomb Web Instrumentation in Honeycomb Documentation
- The Honeycomb OpenTelemetry Web GitHub project page, which defines the HoneycombWebSDK and configures browser telemetry with OpenTelemetry
Want to know more?
Talk to our team to arrange a custom demo or for help finding the right plan.