Want magical per-request instrumentation to roll effortlessly out of your Go app without even looking like you’re trying? Meet the Honeycomb Beeline for Go!
Beelines automatically construct and emit useful events for common components of your application, such as HTTP handlers and SQL connections. You can now instrument these components in just a few lines of code, and the Beeline will automagically send Honeycomb everything you need to quickly start visualizing complex questions, like “what’s the 99th percentile latency of each endpoint?” or “what endpoints are being hit most often?” And if you want to slice and dice additional app context, you can add a custom event field with just one line of code.
What you’ll need
- Go 1.9+
- Go app of your choice
- Honeycomb write key, found on your Honeycomb Team Settings page. (Sign up for free if you haven’t already!)
Setup
go get -u github.com/google/uuid go get github.com/honeycombio/beeline-go
Add this configuration snippet to your application’s startup process to tell it how to send events to Honeycomb.
import "github.com/honeycombio/beeline-go"
...
func main() {
    beeline.Init(beeline.Config{
            WriteKey: "abcabc123123defdef456456",
            Dataset: "myapp",
        })
    ...
Instrument
Find the call where you create your HTTP handler or muxer, and add a Honeycomb wrapper around it. This establishes per-request instrumentation. Here’s an example for a net/http muxer.
import "github.com/honeycombio/beeline-go/wrappers/hnynethttp"
...
http.ListenAndServe(":8080", hnynethttp.WrapHandler(muxer))
If you’re using a different framework, such as goji or gorilla, consult this middleware reference sheet for other options.
Restart your server process and fiddle around in your web app to generate a bunch of requests. Data should now be flowing into Honeycomb!
Explore!
Now that your app is instrumented, let’s do something with your data.
Log in to Honeycomb. You should see a new myapp dataset waiting on your team homepage — let’s open it and find out which endpoints were hit most often.
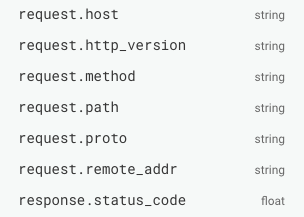
In the sidebar on the right, you’ll see the schema from events that the Go Beeline has automatically sent into Honeycomb. Let’s take a look at the data that was generated from your HTTP requests.
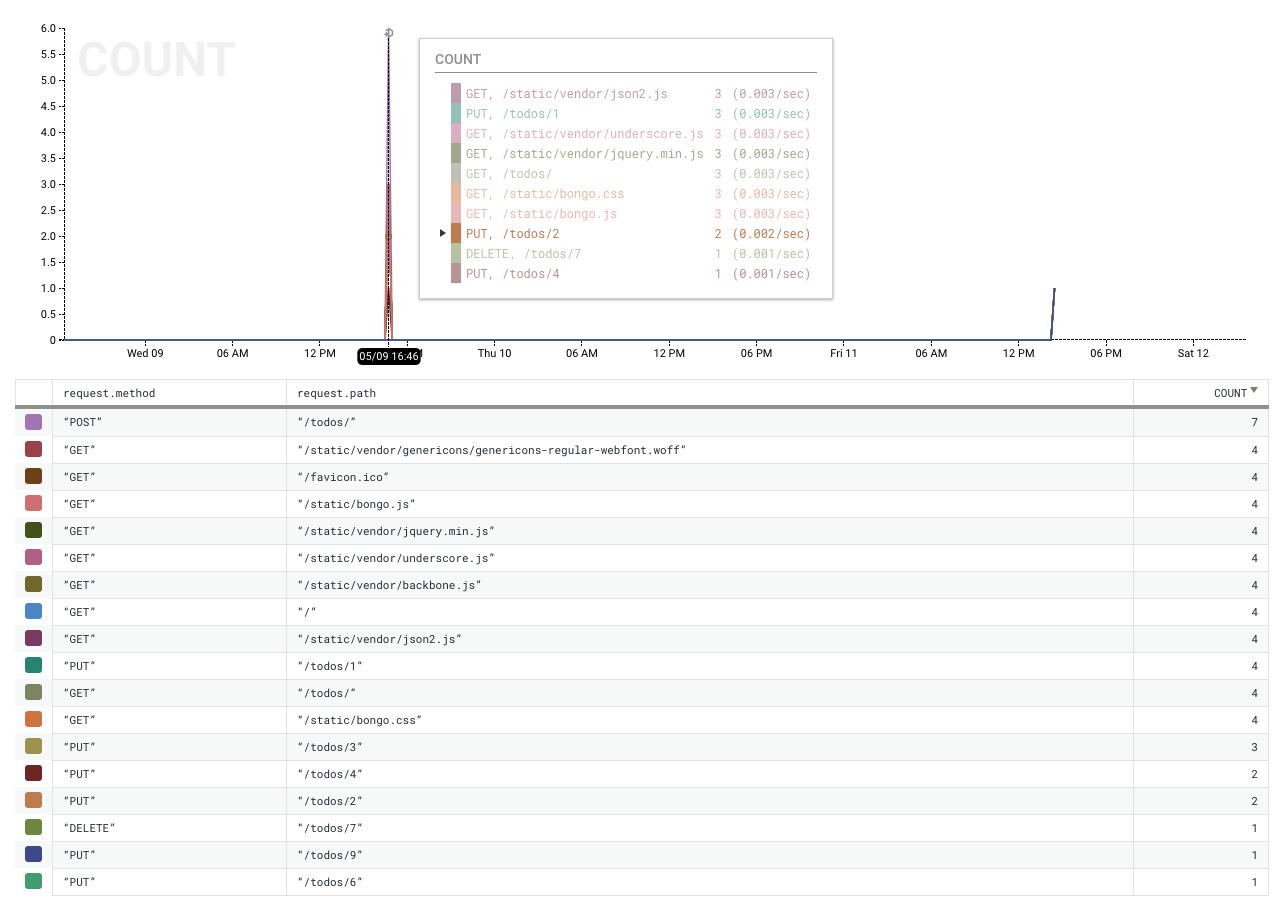
These look promising. Let’s break down by request method and path to get an overview of our app endpoints, and calculate the COUNT to find out how many times each endpoint was used.
That’s all you need to start visualizing and investigating your app behavior in Honeycomb! Learn more here about exploring your data and constructing queries in Honeycomb.
Customize
Let’s say you want to ask more customized questions, like “which users are using the endpoint I’d like to deprecate?”Anywhere you have access to your newly-Honeycomb-ified HTTP request object, you can add custom information onto the event associated with that request.
beeline.AddField(req.Context(), "user_id", myUser.ID)
Enjoy!
If you want to customize your beeline beyond what the Quickstart has to offer, you can find the full documentation here.
Haven’t tried Honeycomb before? Sign up for free!


