New to Honeycomb? Get your free account today!
We love to talk about the value of observability in accelerating feedback loops by enabling teams to understand what changes they need to make to software. But a barrier that often holds teams back from completing the feedback loop is how long it takes to actually get feedback on code under development, or push code into production. If it feels like you’re operating the Mars Rover manually with a minutes-long delay between putting in a command and seeing results, it doesn’t matter how quickly you can analyze and get results within the Honeycomb product.
The importance of short build times
At Honeycomb, we believe in ensuring an awesome developer experience for our own engineering teams; it’s the only way that we can compete with companies that have way more engineers than we do. We’ve historically tried to keep our build times under 15 minutes, taking percussive action when build times got over 15 minutes. In fact, we have an internal Service Level Objective (SLO) on the data which alerts us if more than 5% of builds take longer than 15 minutes!
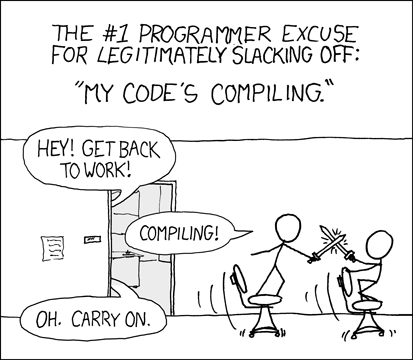
But it turns out that 15 minutes is still not a great experience; we’d find devs would task-switch rather than wait for builds to complete, losing valuable state and context in their heads. Ideally, build times under six to seven minutes mean developers stick around to watch their builds and are ready to rapidly correct CI failures. The state never gets paged out of someone’s head as they turn to Slack or pull the next ticket while waiting for the build.
Switching CI providers for speed and reliability
As an example of us taking major action to preserve build time goals, between June 2018 and May 2019, the median amount of time it took to build Honeycomb doubled from seven minutes to nearly 14 minutes. This prompted us to switch from TravisCI, which offered limited concurrency, to CircleCI, which offered better concurrency.

Since then, we’ve leveraged CircleCI’s concurrency and caching features to keep our tests running as quickly as possible while our codebase and developer count has grown. We went from 10-20 pull requests landing on the main branch per week to 100+ consistently every week. The total number of lines of code in our codebase approximately doubled over the past five years, increasing the amount of work incurred both for compilation and for unit testing.
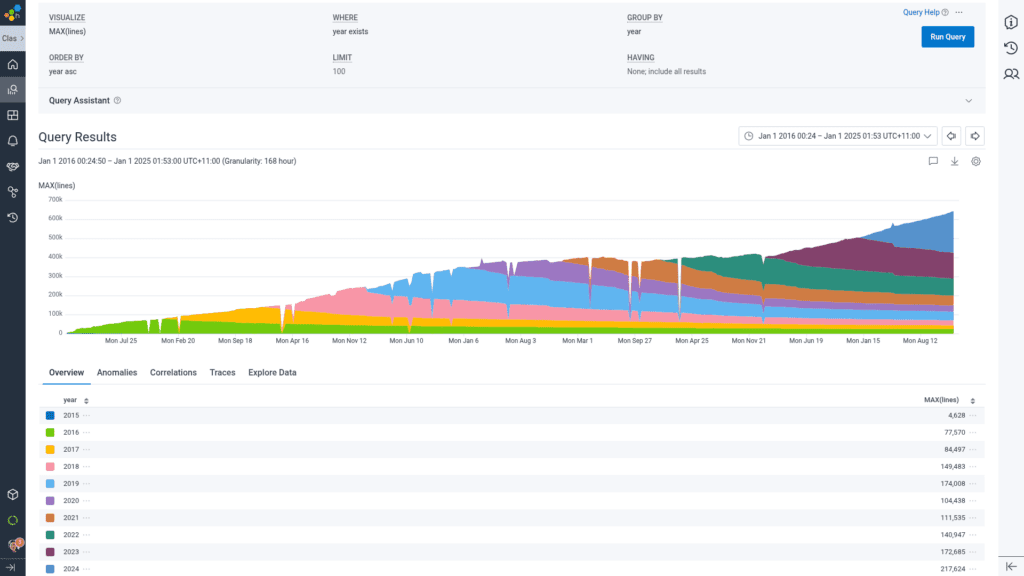
Build times climbed again
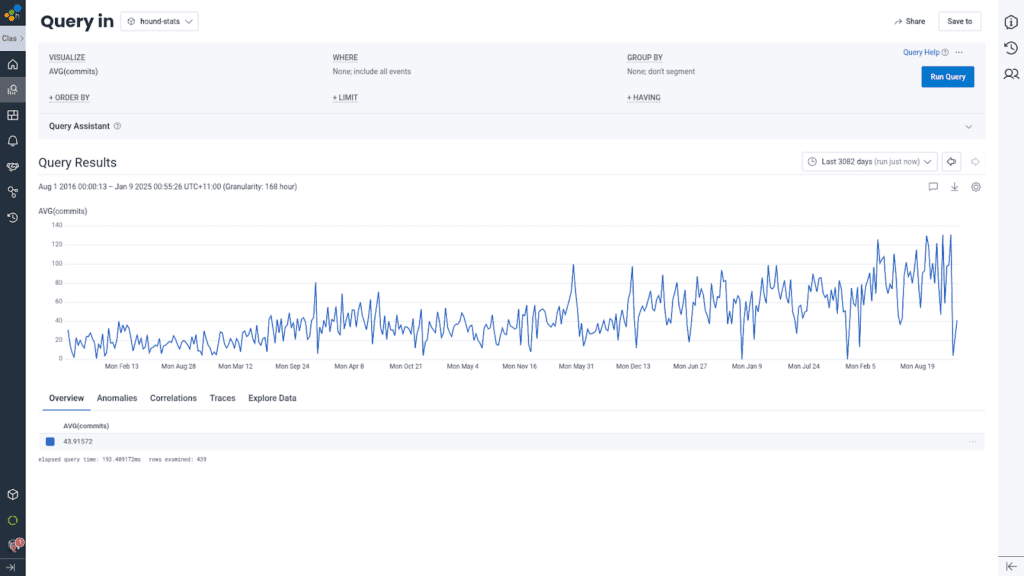
By 2023, things started to get considerably creaky. Over 25% of commits were taking longer than 12 minutes to pass CI, even worse than the threshold that caused us to abandon TravisCI. We tried increasing the number of parallel test runners, but to very little marginal benefit (thank you, Amdahl’s Law) as each test runner still has to do the work of setting up. Radical action appeared necessary to bring our test times back to what we previously had as a norm.
I hit my own personal breaking point with build time after an outage, trying to investigate a strange stack corruption issue that we thought was in the Go runtime, but turned out to be a bug in the x86_64 assembly of a library we depend upon. It was maddening having every build take 15 minutes to complete, deploying the build, testing whether the bug reproduced, and then repeating again to bisect the problem.
As Field CTO, I try not to get in the path of time-sensitive feature delivery, but this smelled like a problem that was both important and had no specific urgency to solve—precisely my jam. Attacking this problem became a key focus of my Q4.
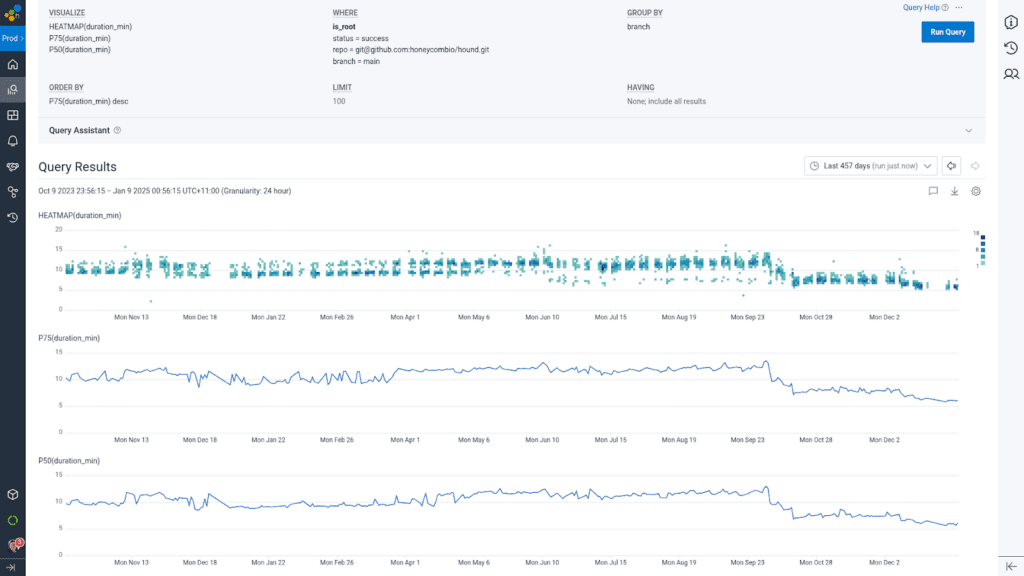
Let’s fix these build times!
The first step was to study traces from our CircleCI buildevents orb to understand where all of the time was going. The tests actually were some of the faster parts of the build, and it was the binary build and artifact creation/upload steps that were the slowest. Why?
Build steps
To our surprise, the main issue holding back our performance was transferring files between different build steps. Nearly 3.5 GB of data was being passed between intermediate steps and the final jobs that uploaded the built artifacts. We discovered that the data was being gzipped rather than compressed with zstd, so meaningful size reductions purely through compression were not possible.
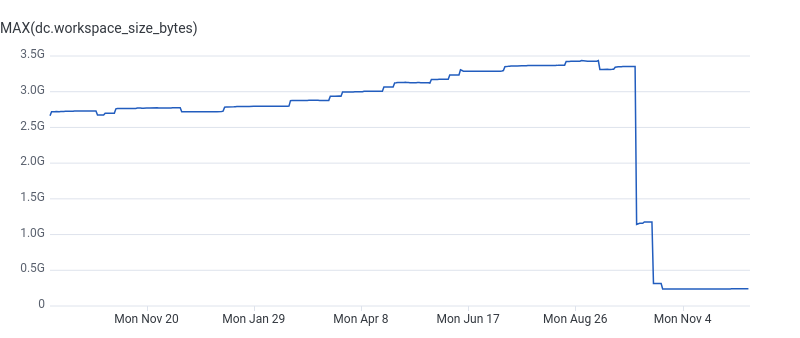
Instead of trying to compress the data, I started thinking about whether it was possible to entirely avoid moving all that data around. The primary artifacts we need to ship to our Kubernetes cluster are Go binaries and bundled-and-minified Javascript built with Webpack. Those get compiled into images pushed to ECR, as well as archival unstripped copies of the binaries uploaded to S3. But with our move of all of our services to containers and Kubernetes, there no longer was a need to upload stripped binaries both to tarballs stored in S3, as well as making those binaries part of the ECR images. What if we could just build everything in one single step and avoid shipping state around?
Docker Bake
The first thing that we considered was doing an omnibus build step to do the Go build, then doing the Javascript build, then bringing it all together into build artifacts. While this minimized data transfer, it was horrifically inefficient to run the steps in serial, waiting for each step to finish before starting the next step. My research then took me toward Docker Bake, a relatively new (introduced in 2019 and popularized around 2022) method of chaining together multi-step Docker image builds.
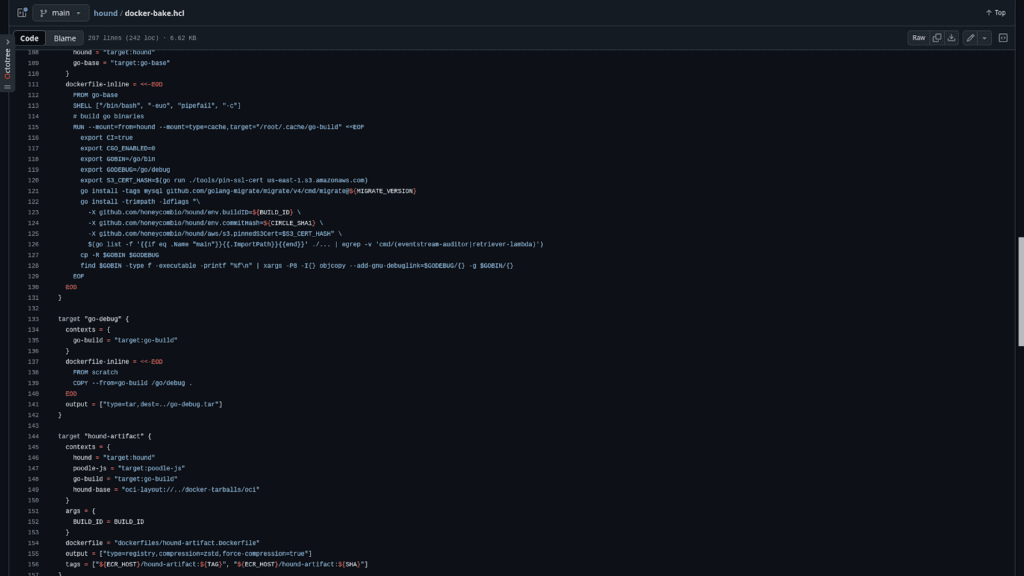
Parallel builds
By allowing steps to progress independently and block only when they needed files from the output of a step from a parallel build step that had not yet finished, we were able to effectively interleave multiple parallel builds on a single virtual machine. You’d think that CircleCI’s built-in support for Docker Layer Caching (DLC) would potentially be helpful here as well, but our experience was that for the same reasons that passing state in the CircleCI workspace was slower than we would have liked, that compressing/uncompressing and passing in indiscriminate amounts of cached data via DLC was going to take longer than creating the state from scratch, or passing in base layers generated from periodically built and explicitly cached tarballs.
Removing bottlenecks
Migrating the steps from separate CircleCI jobs run on their Docker executor into a single Docker Bake on a CircleCI machine executor allowed us to establish what the floor of our build time ought to be; we then carefully adjusted parallelism to make the tests (which still run in normal CircleCI parallel runners, using CircleCI’s parallel test sharding helper code) take approximately the same amount of time. We spent a lot of time staring at graphs generated using buildevents data to understand the normal distribution of latency of each step to ensure that no single job would be the bottleneck. For instance, we discovered that steps like initializing our test database for Go integration tests that previously had little effect on total build time now needed themselves to be optimized.
Caching network fetches
We also were able to dive in to look at individual traces to see if there were specific steps that contributed to tail latency and squish those down through more aggressive caching. For instance, we found that the necessary steps to update the system dependencies for puppeteer usually ran fast but could have enormous variance so it was better to pay a flat tax of a few seconds to cache the apt lists and deb packages from the day’s first run instead of re-downloading every time.
Results
One of the really cool things that happened during our investigation was stitching together buildevents traces at the CircleCI job and step level together with the actual Docker buildkit command tracing data. It turns out that buildkit has integrated OpenTelemetry support since its inception, so by setting environment variables for TRACEPARENT to make it match the buildevents trace and span IDs, we were able to directly see each individual command execution, ECR upload step, and blocking while waiting for other steps to complete.
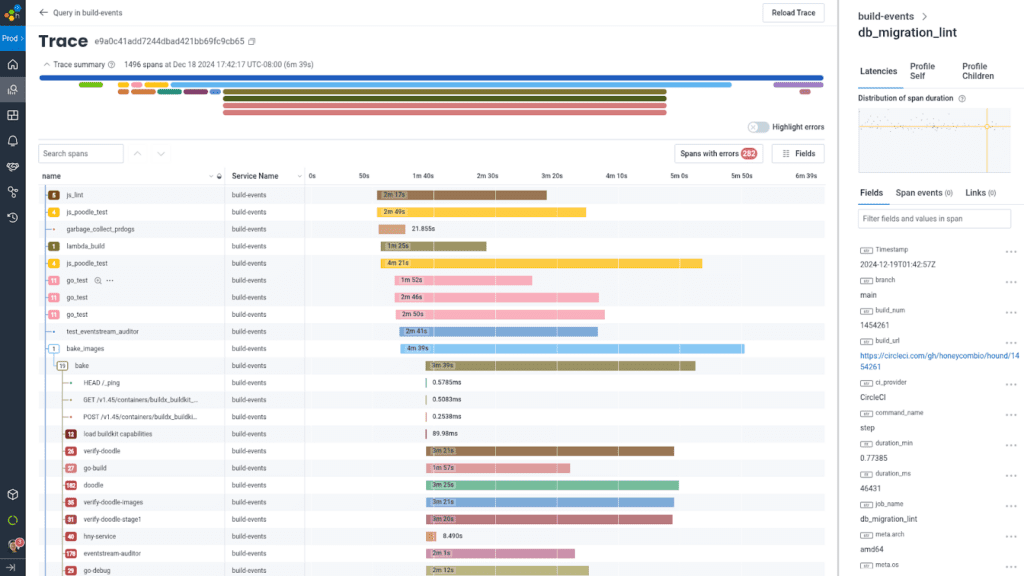
Even though there were a few small bumps in the process of rolling out these changes (notably, an occasion in which we failed to set -euxo pipefail on a build step ignoring a failure to generate a list of which tests to run, resulting in tests being skipped until we noticed), the payoff of having build times consistently below seven minutes was well worth the effort.
What’s next for us? We’re curious about using tools like Depot or Namespace to do DLC without having to pay the cost of hydrating/dehydrating the cache.
Ever faster!


